UMAP Embedding Dashboard
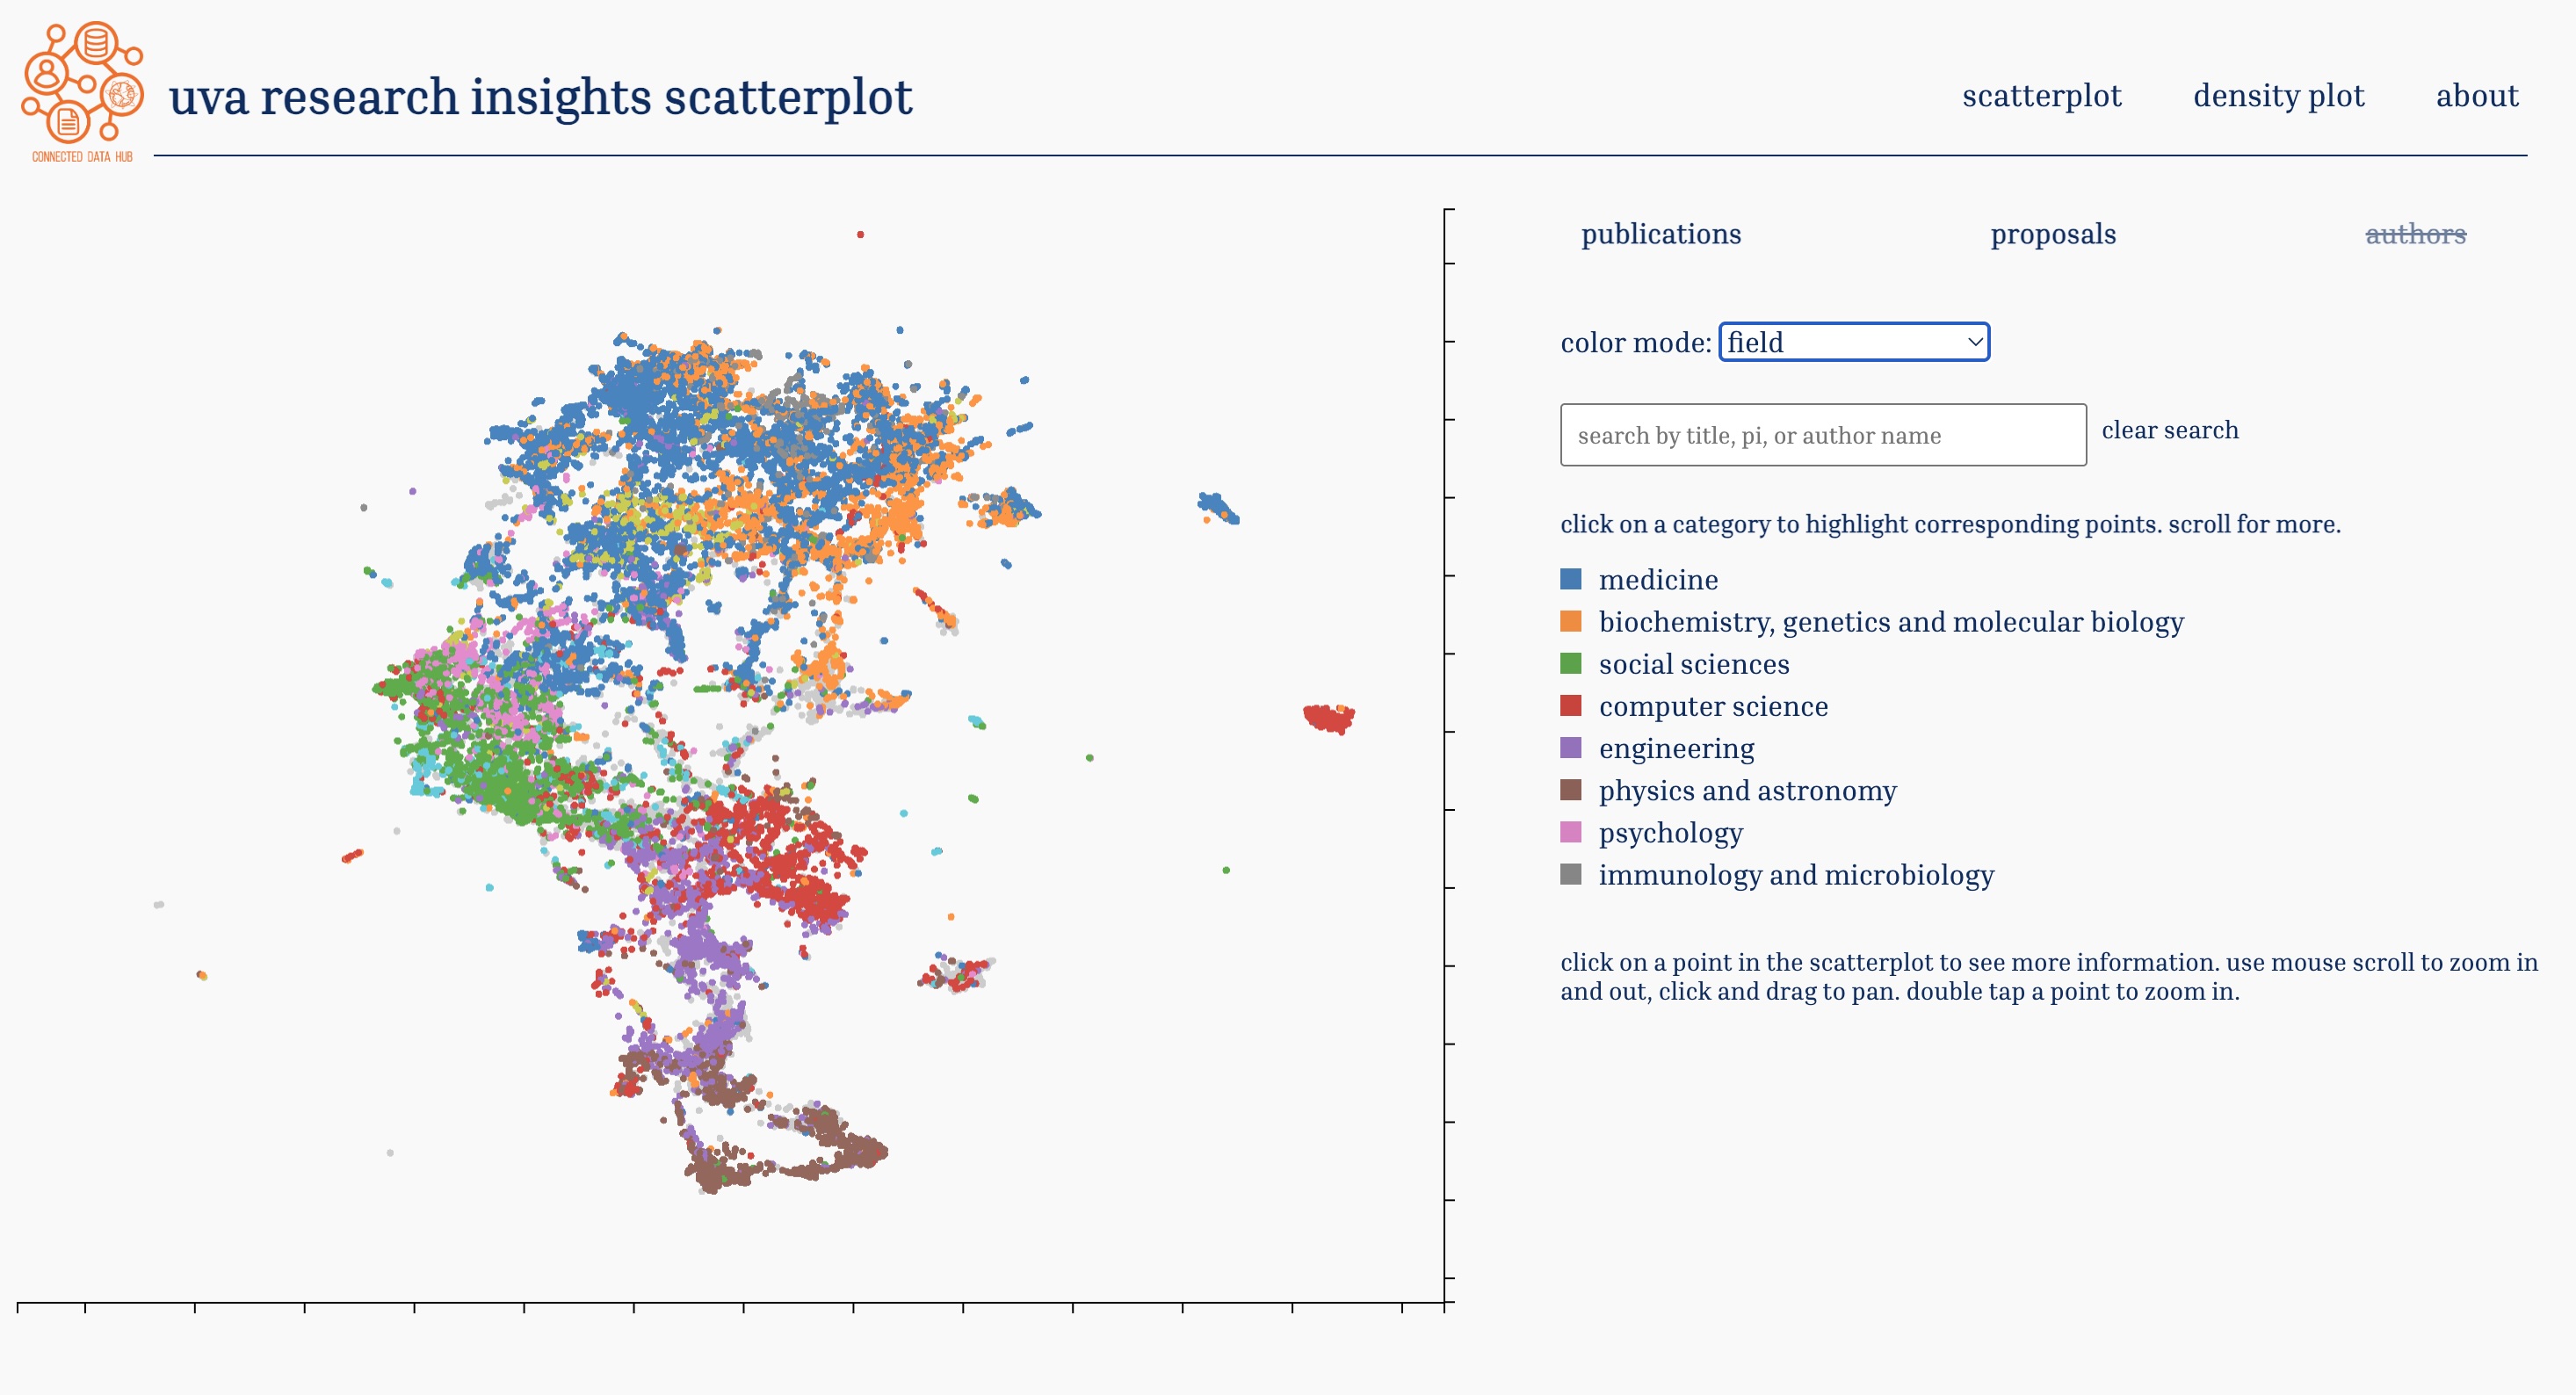
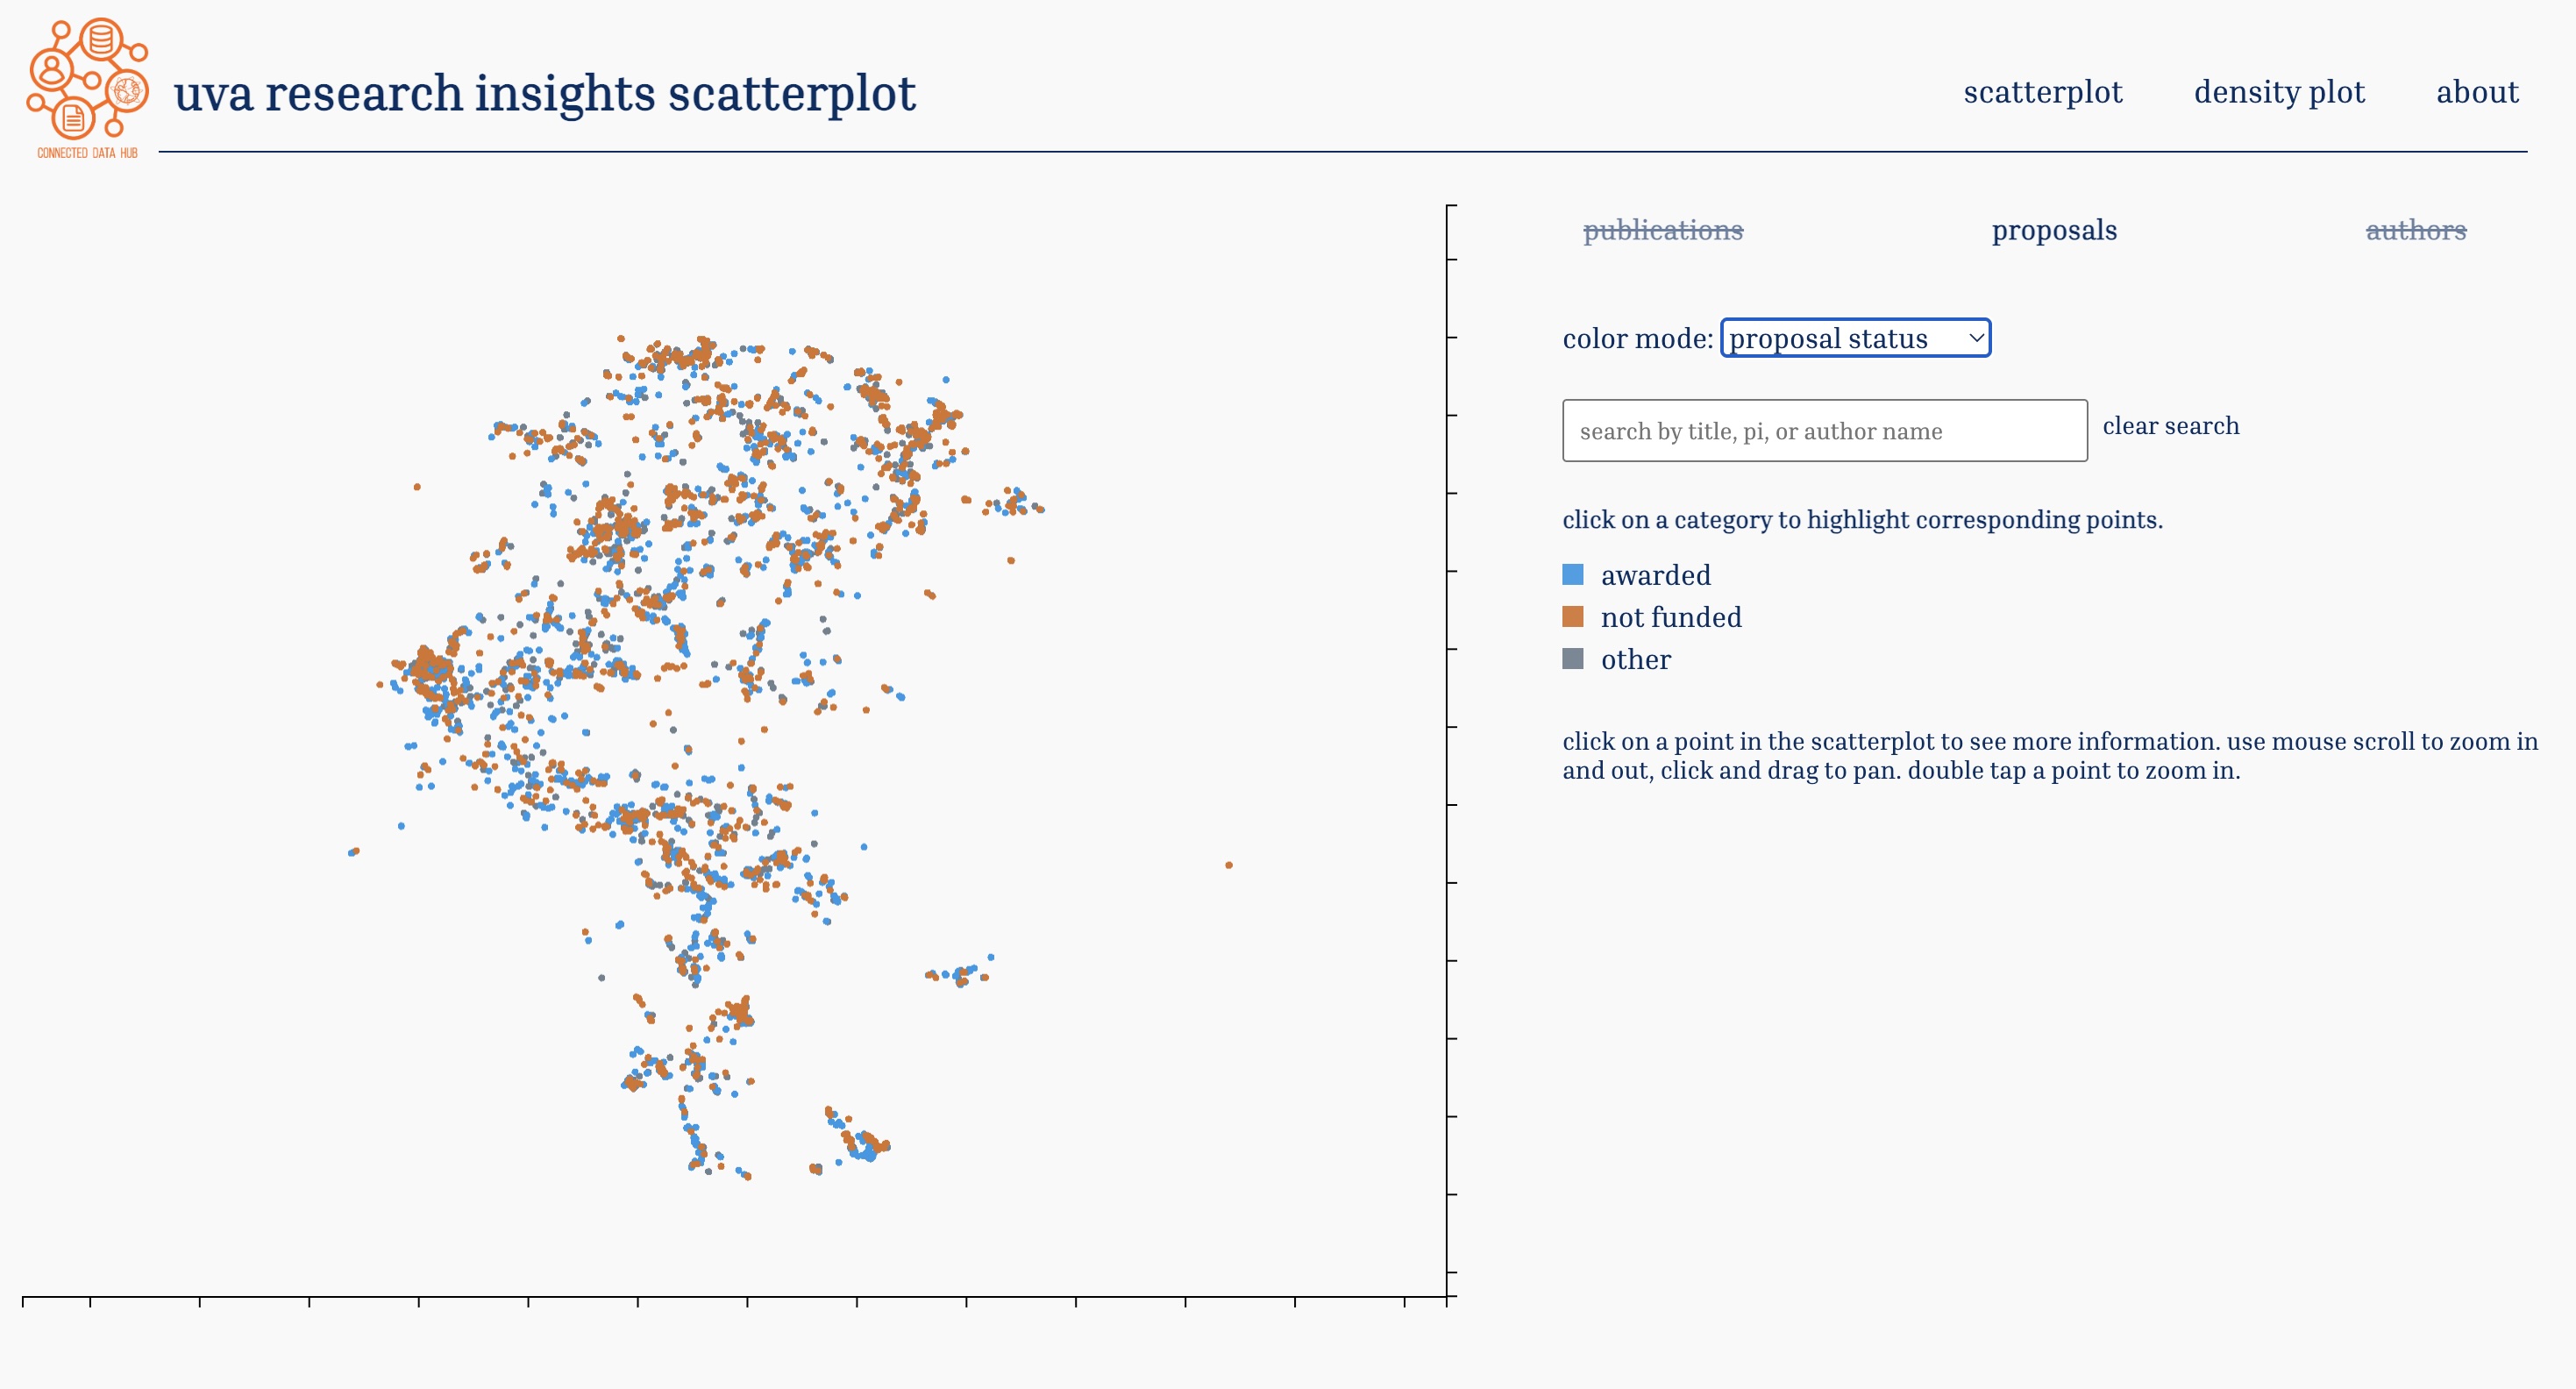
UMAP Scatterplot by Field of Study
April 2026
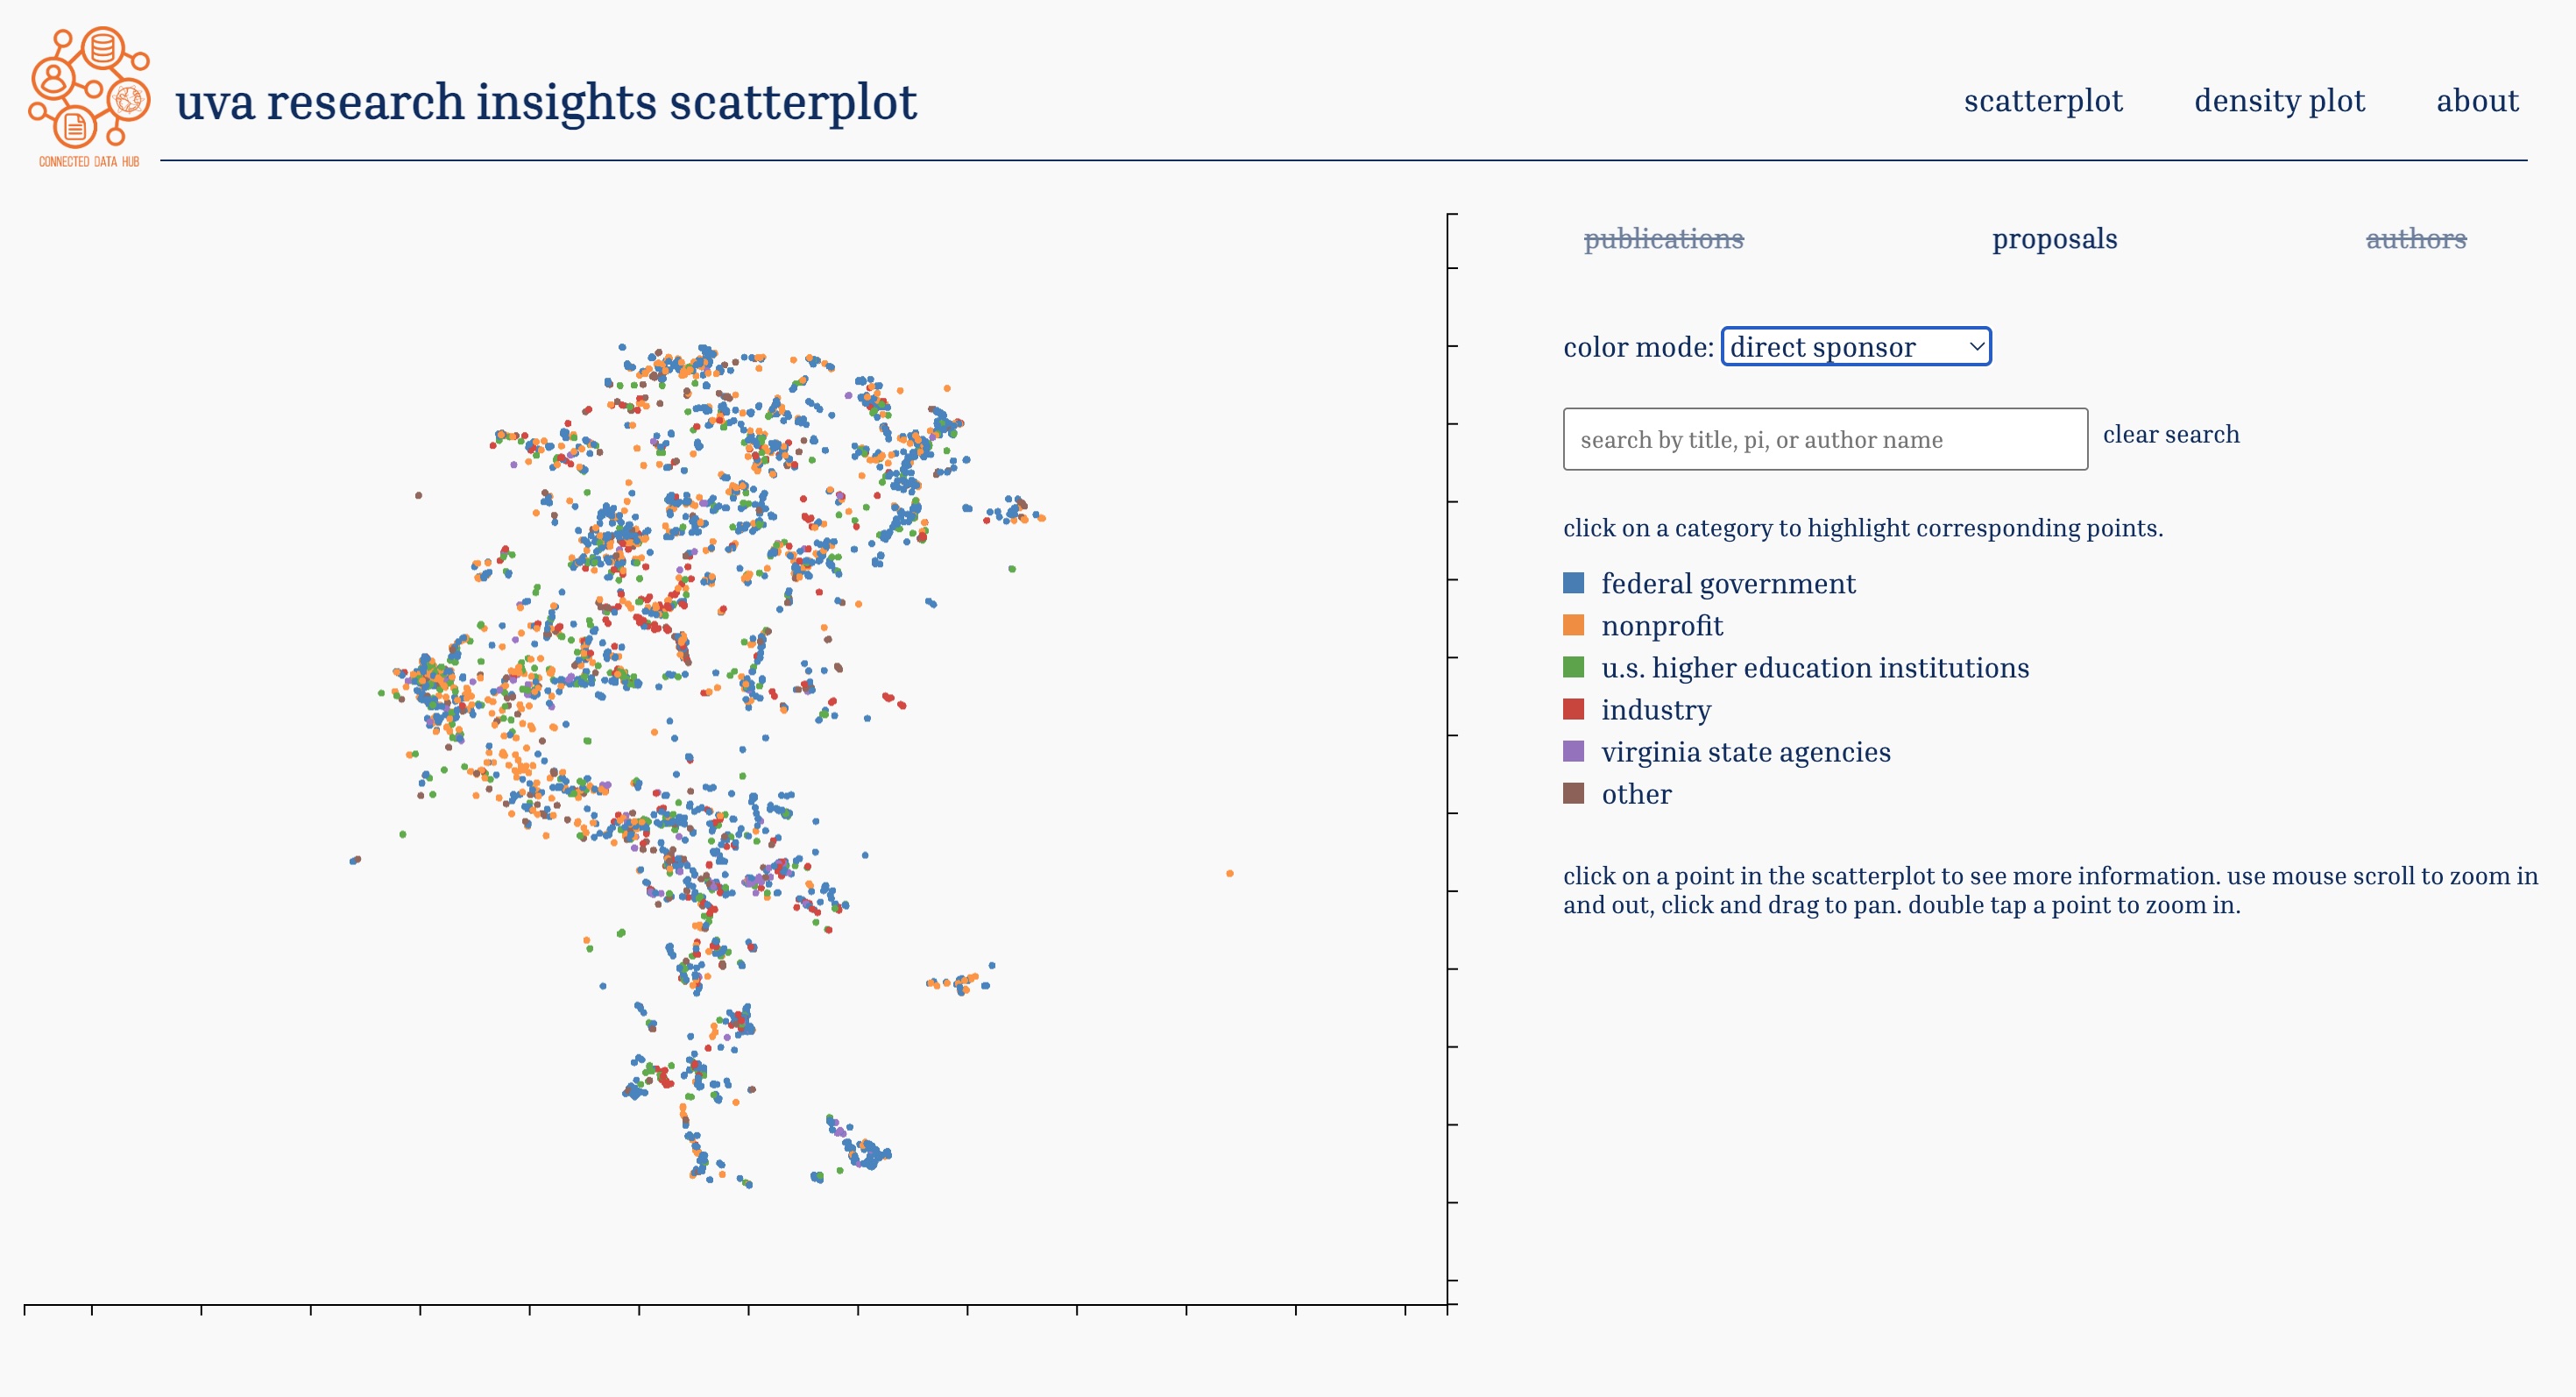
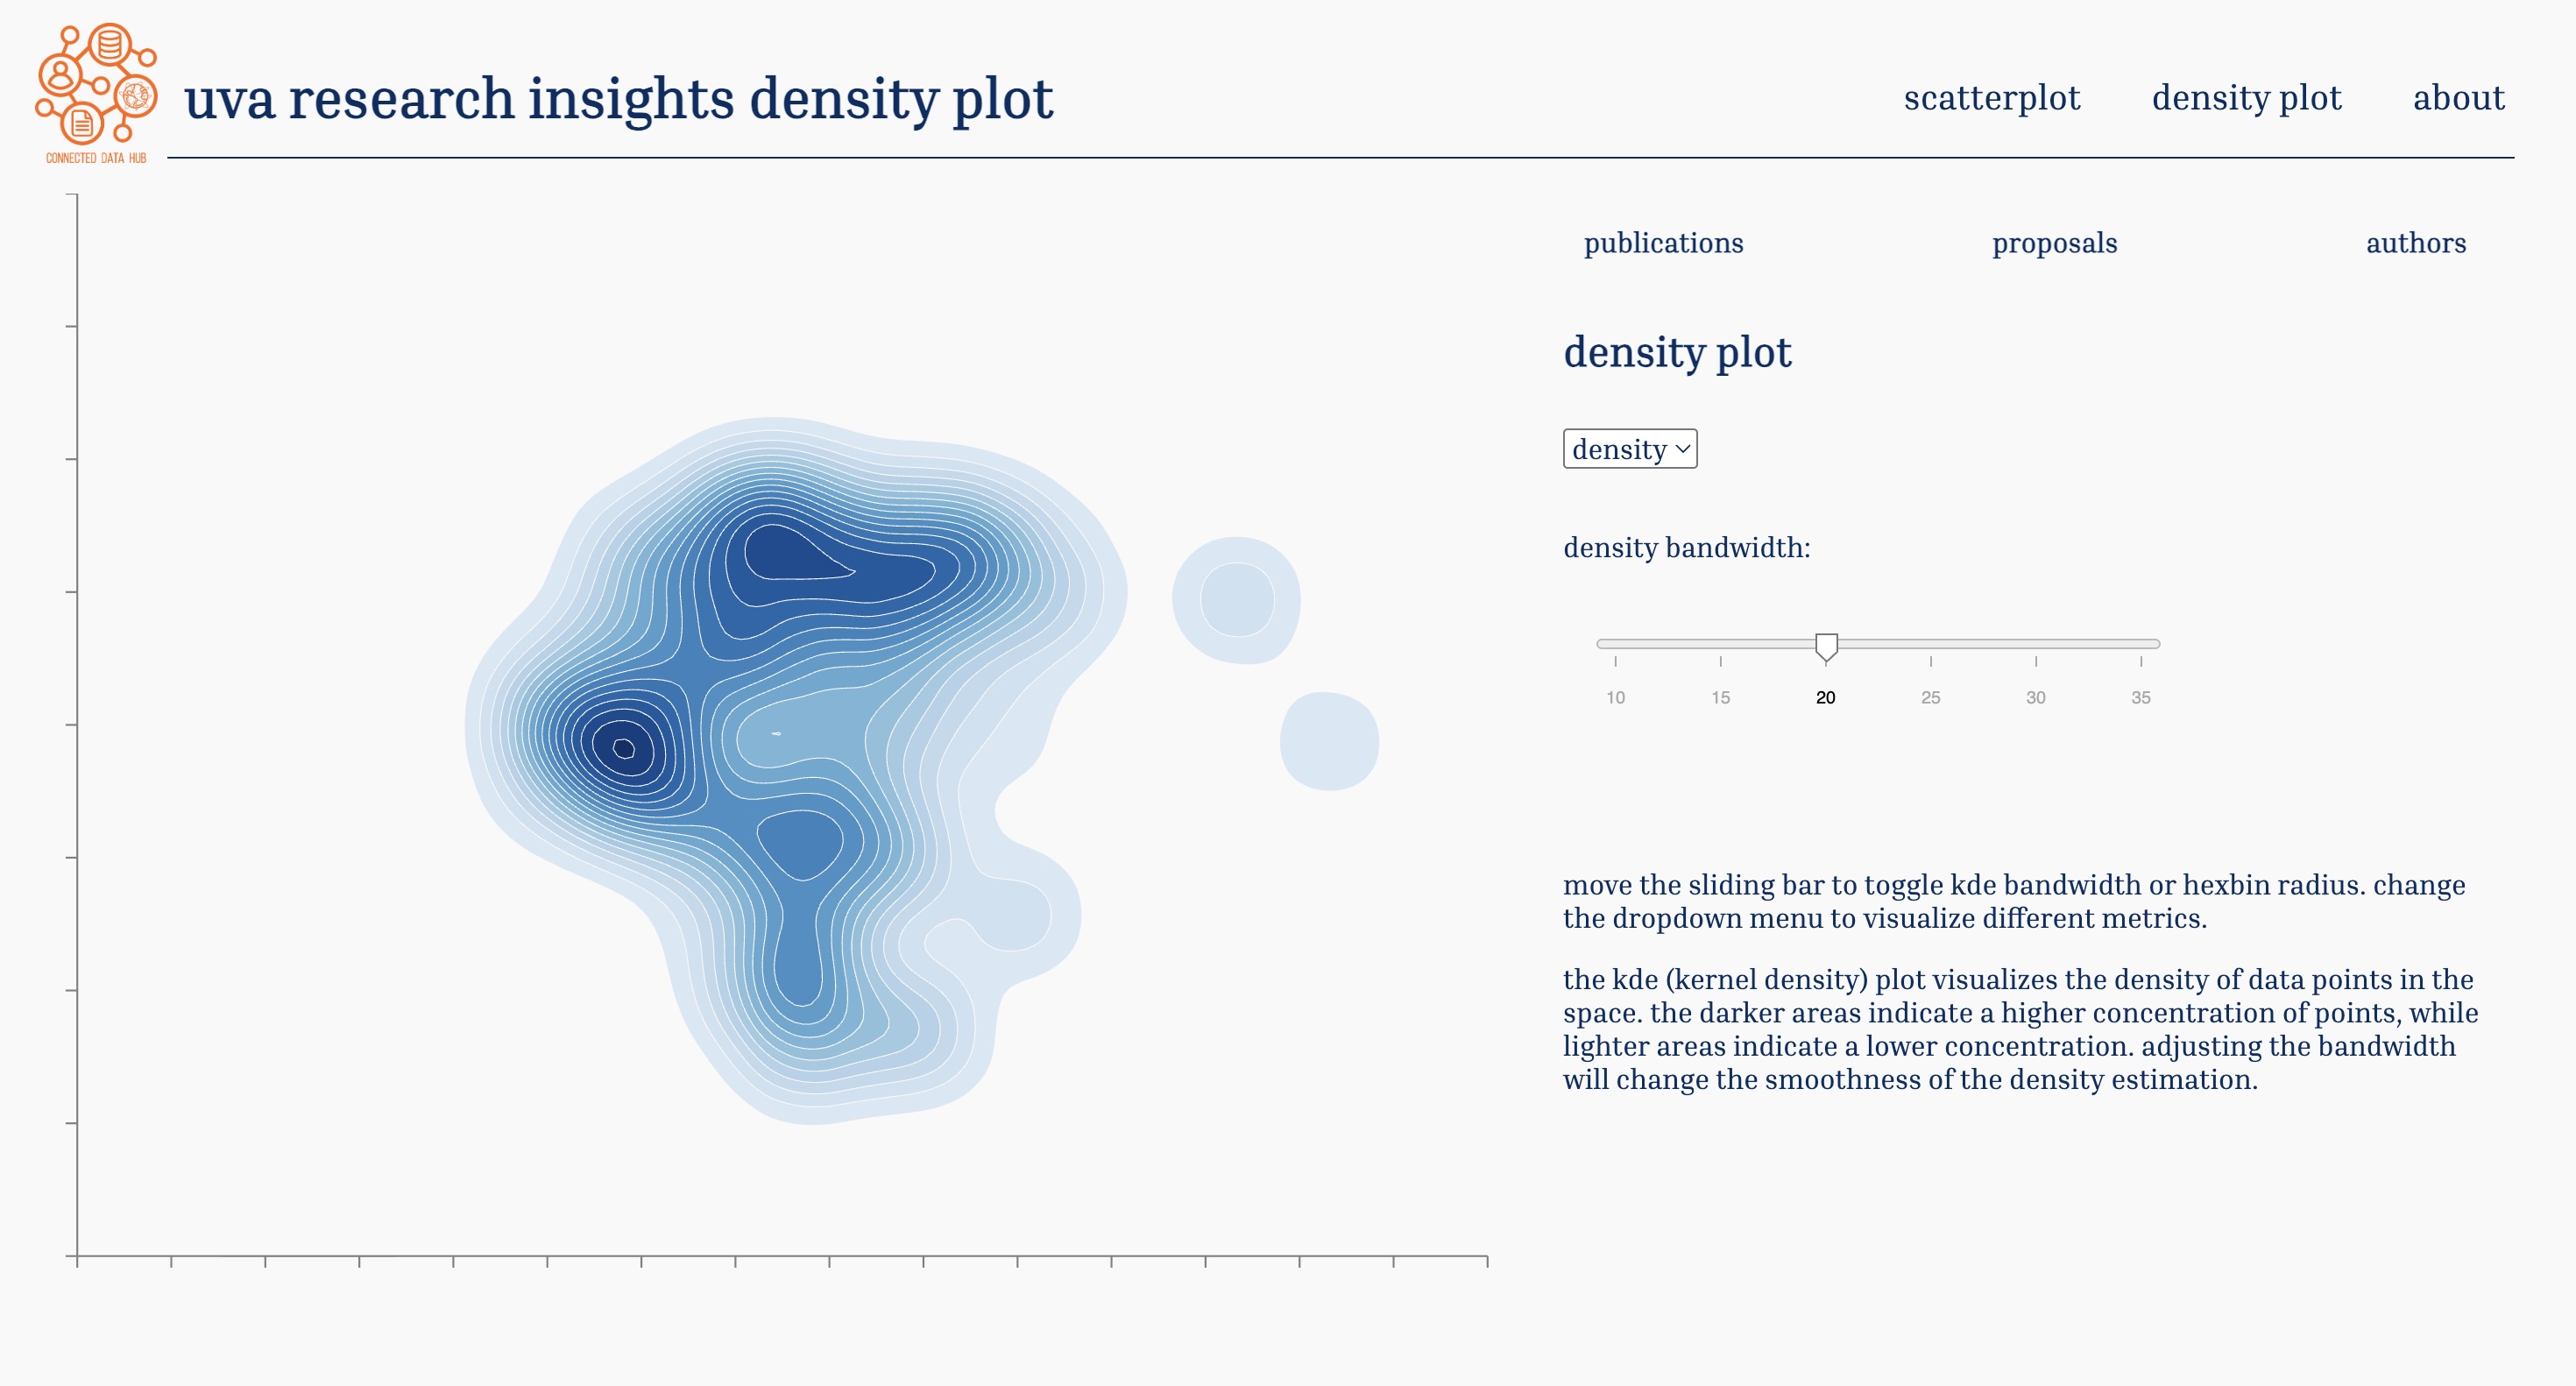
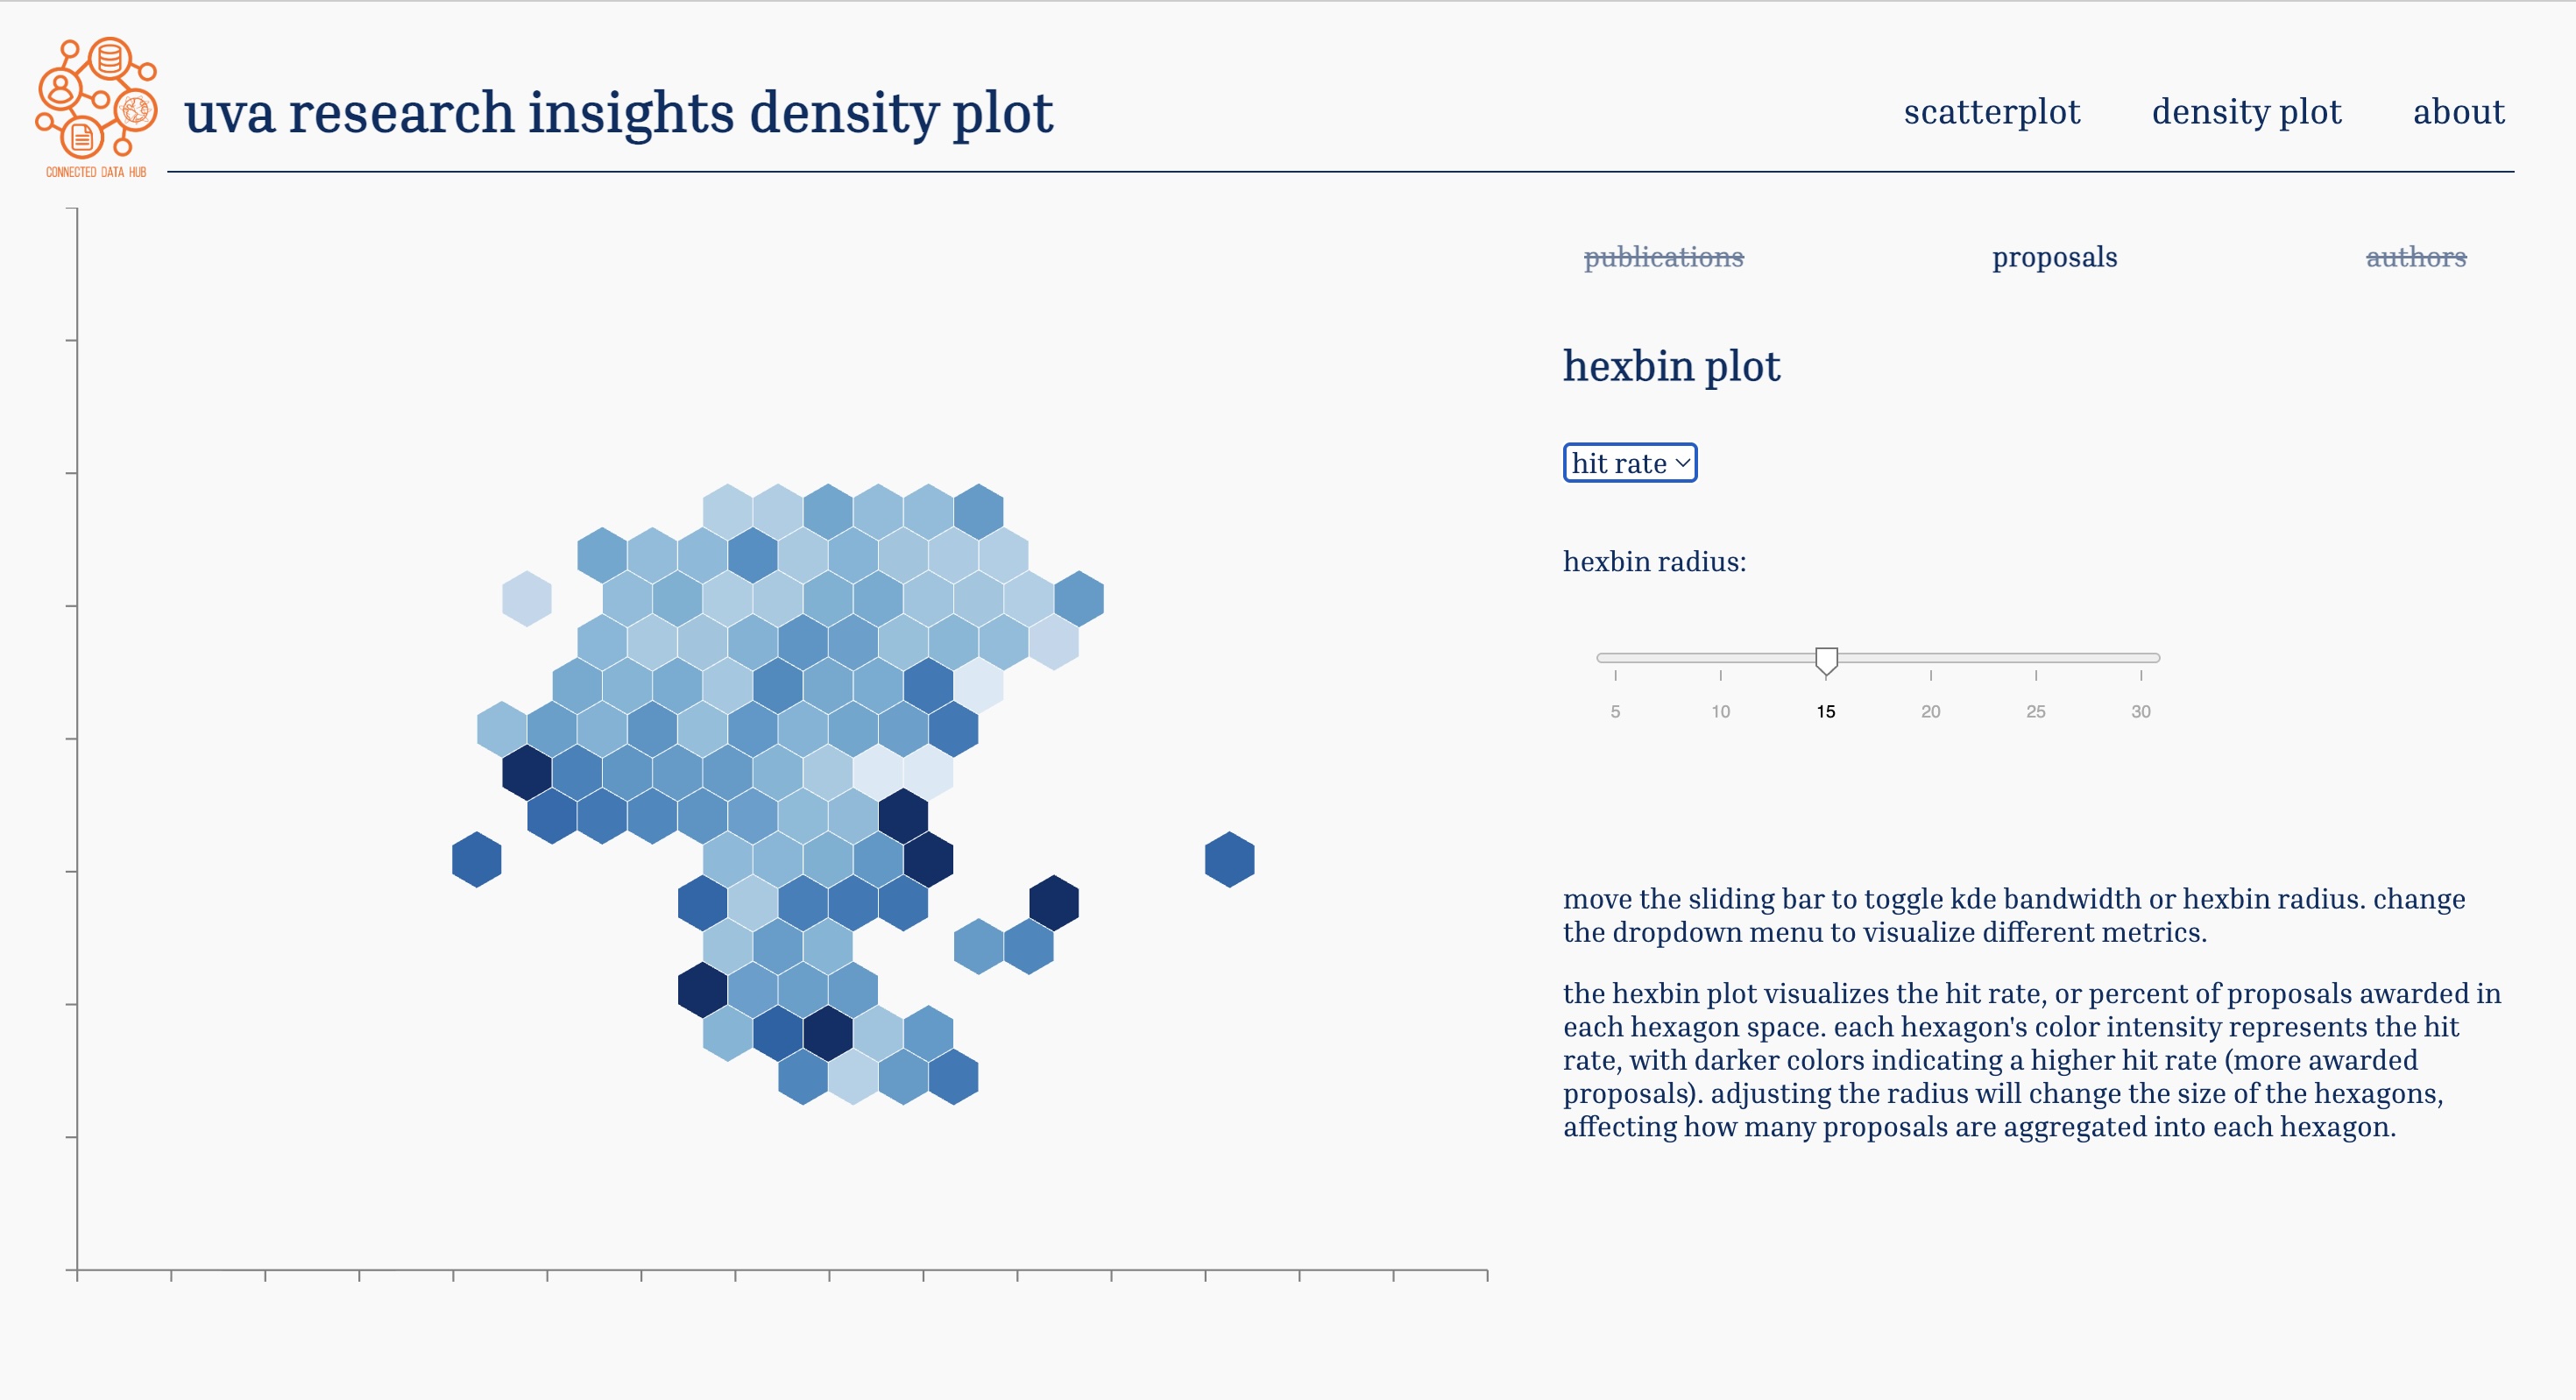
Commissioned project for the Research Team at UVA through the Connected Data Hub. Using preprocessed data from my research coworker, I designed and implemented this interactive dashboard that includes a UMAP embedding space of 44,000+ publications and proposals from UVA, an author/title search bar, color categories including field of study, grant status, grant sponsor, and sponsor amount, a kernel density plot of research output distribution, and a hexbin plot showing hit rate of awarded proposals on the embedding space.
The dashboard is built with HTML, CSS, and JavaScript, and utilizes the D3.js library for data visualization. It was deployed via GitHub Pages, with data pulled from an AWS S3 bucket.
The current website is unavailable and under University protection due to data confidentiality, but the code files are available on my GitHub repository.
Tools/ Skills: Figma, Python, HTML, CSS, Javascript, D3.js