UVA Coauthorship Network and Research Sunburst
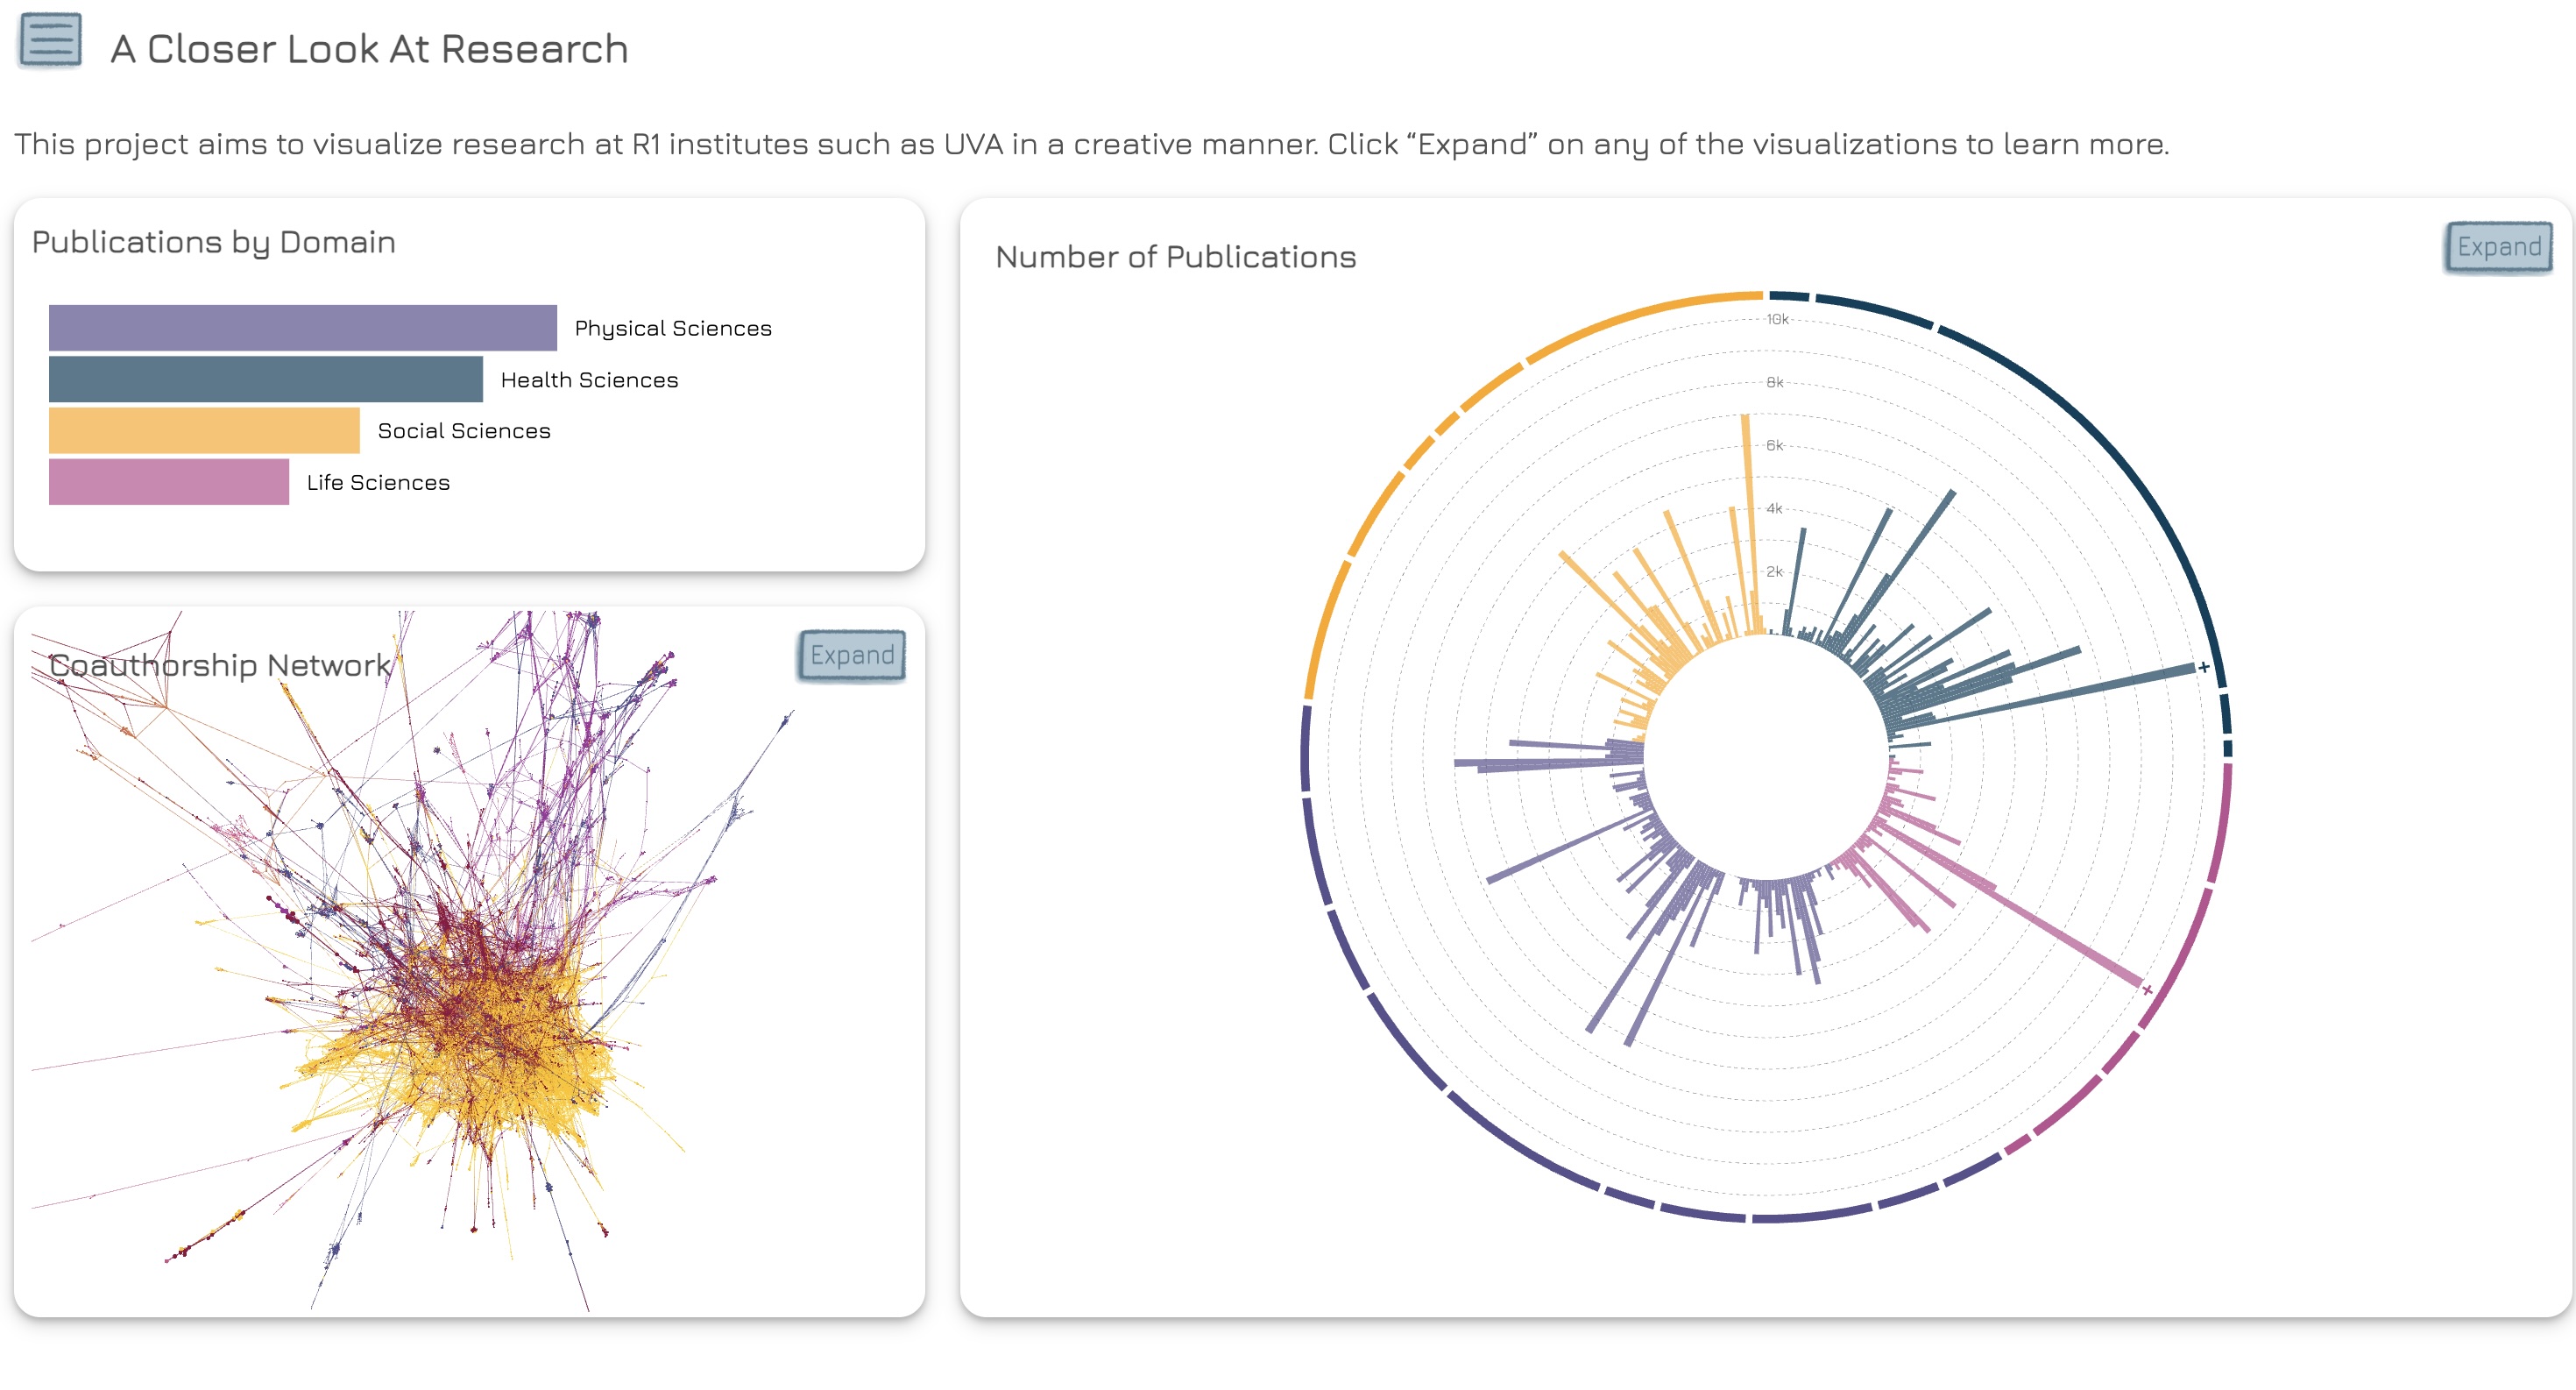
Dashboard display
May 2026
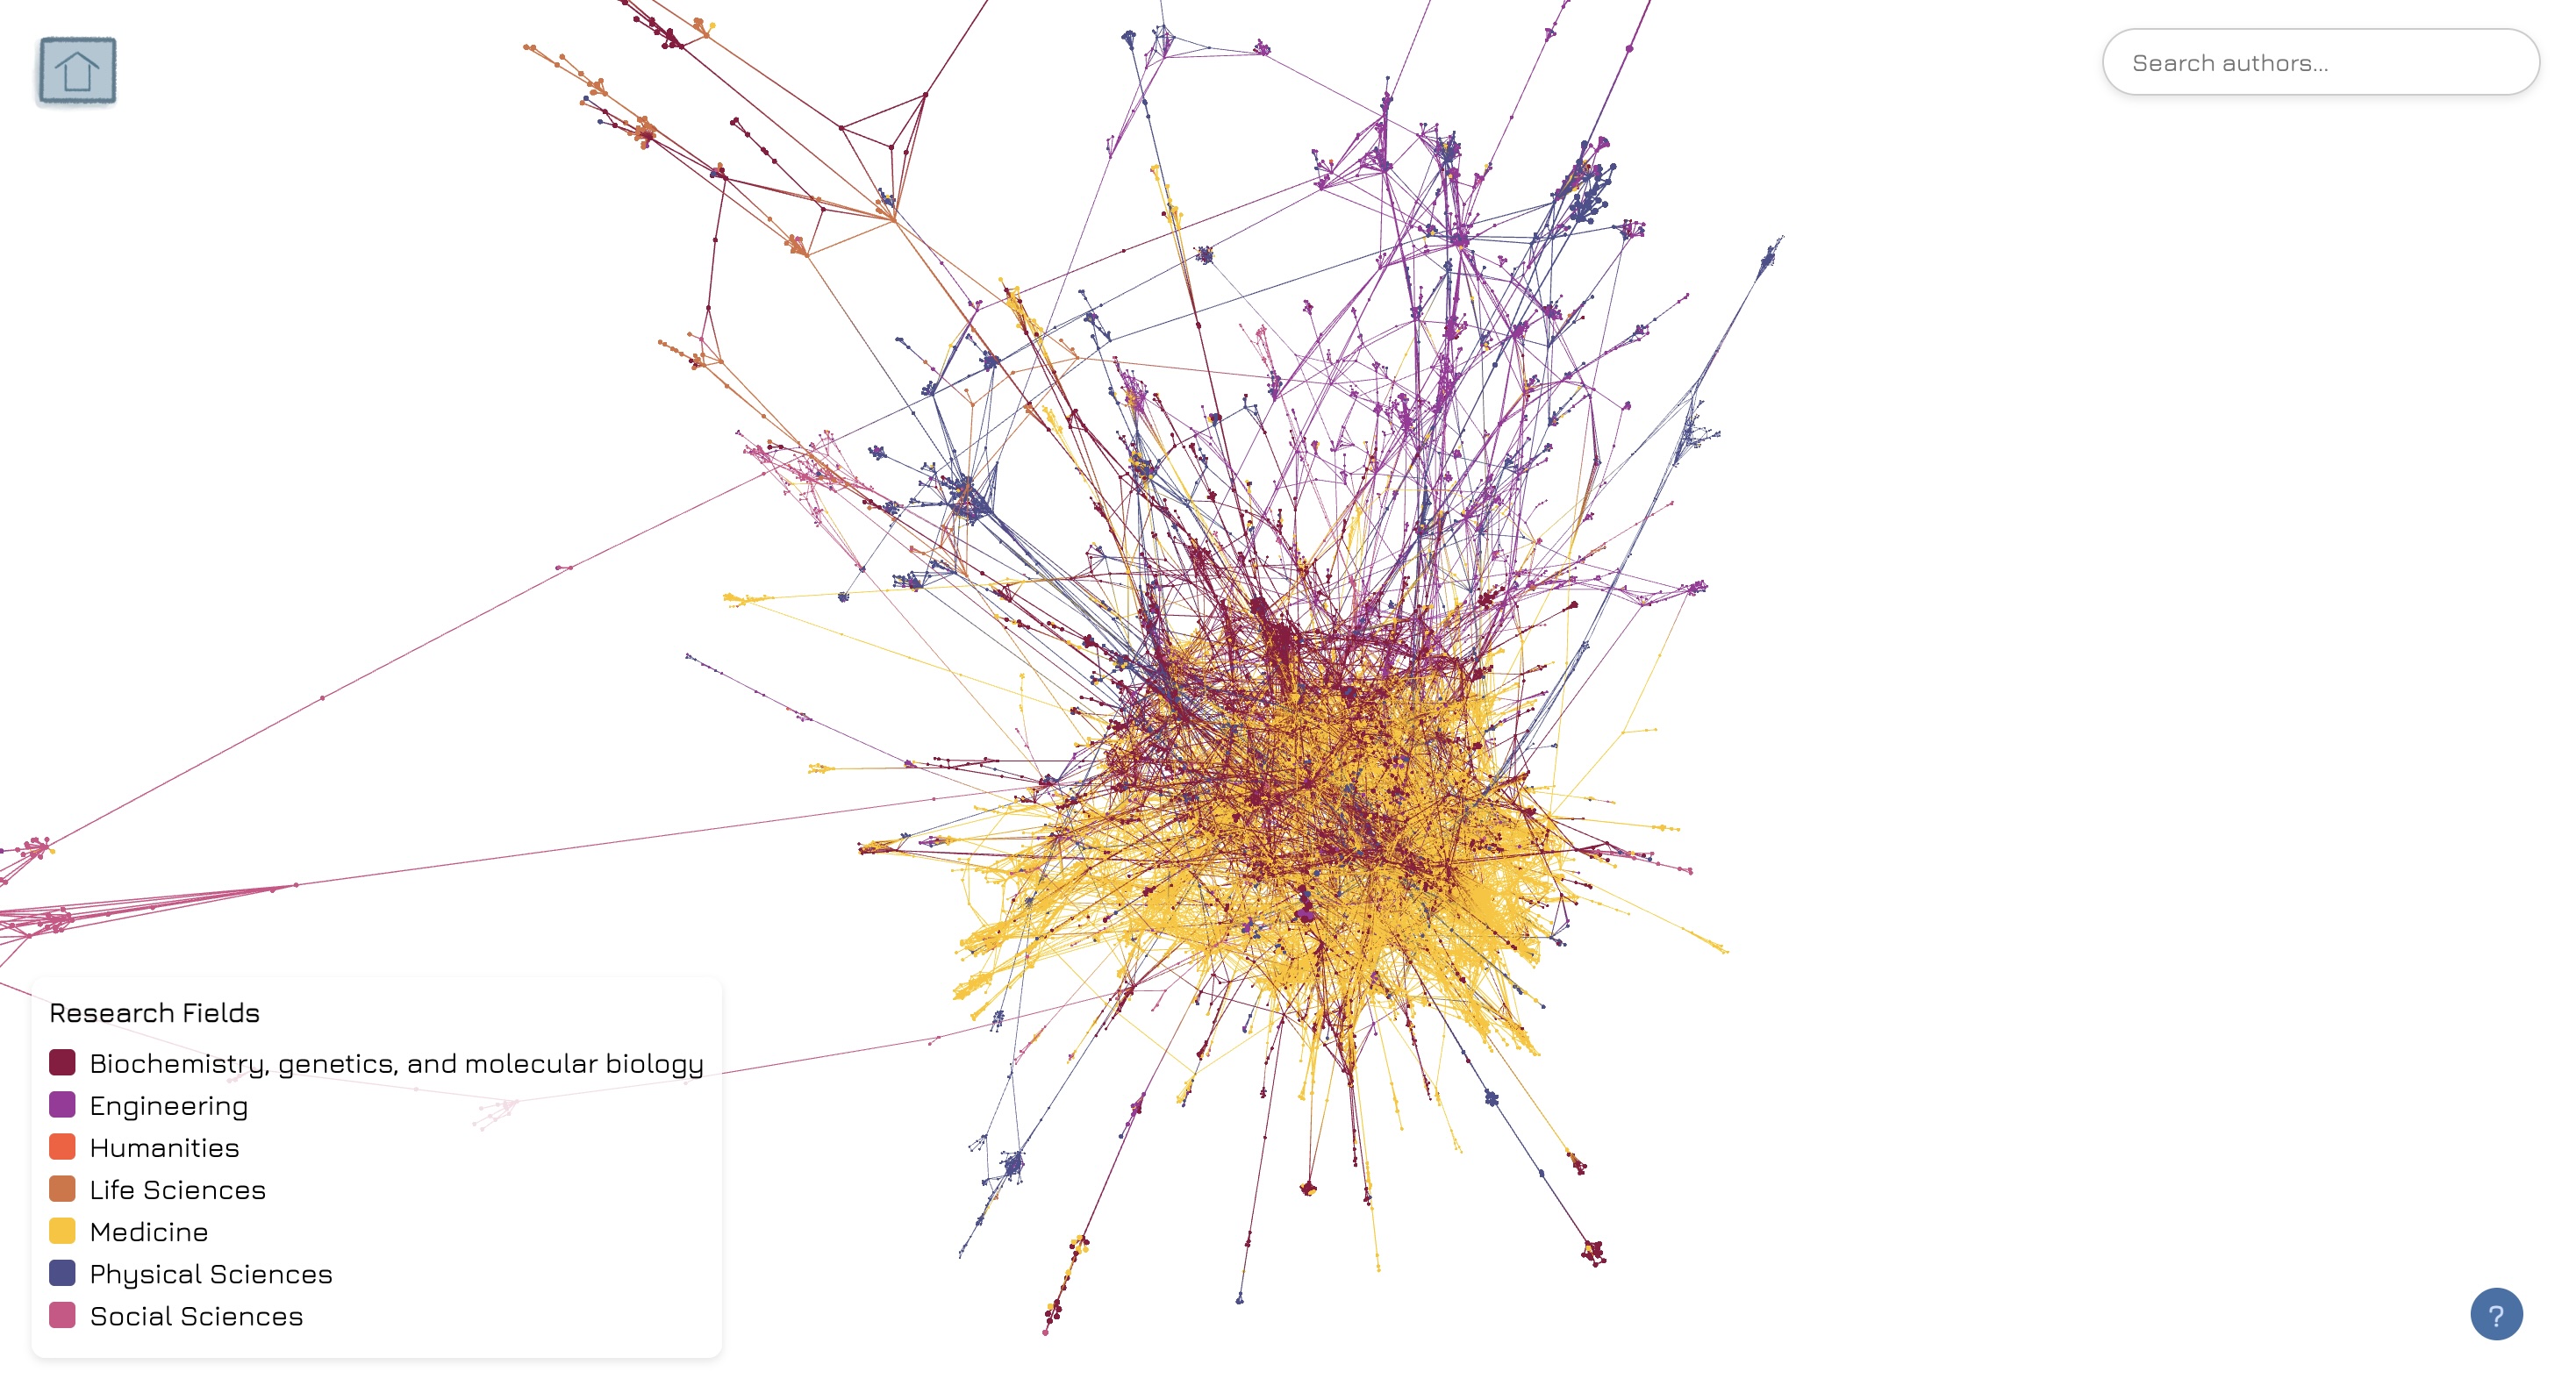
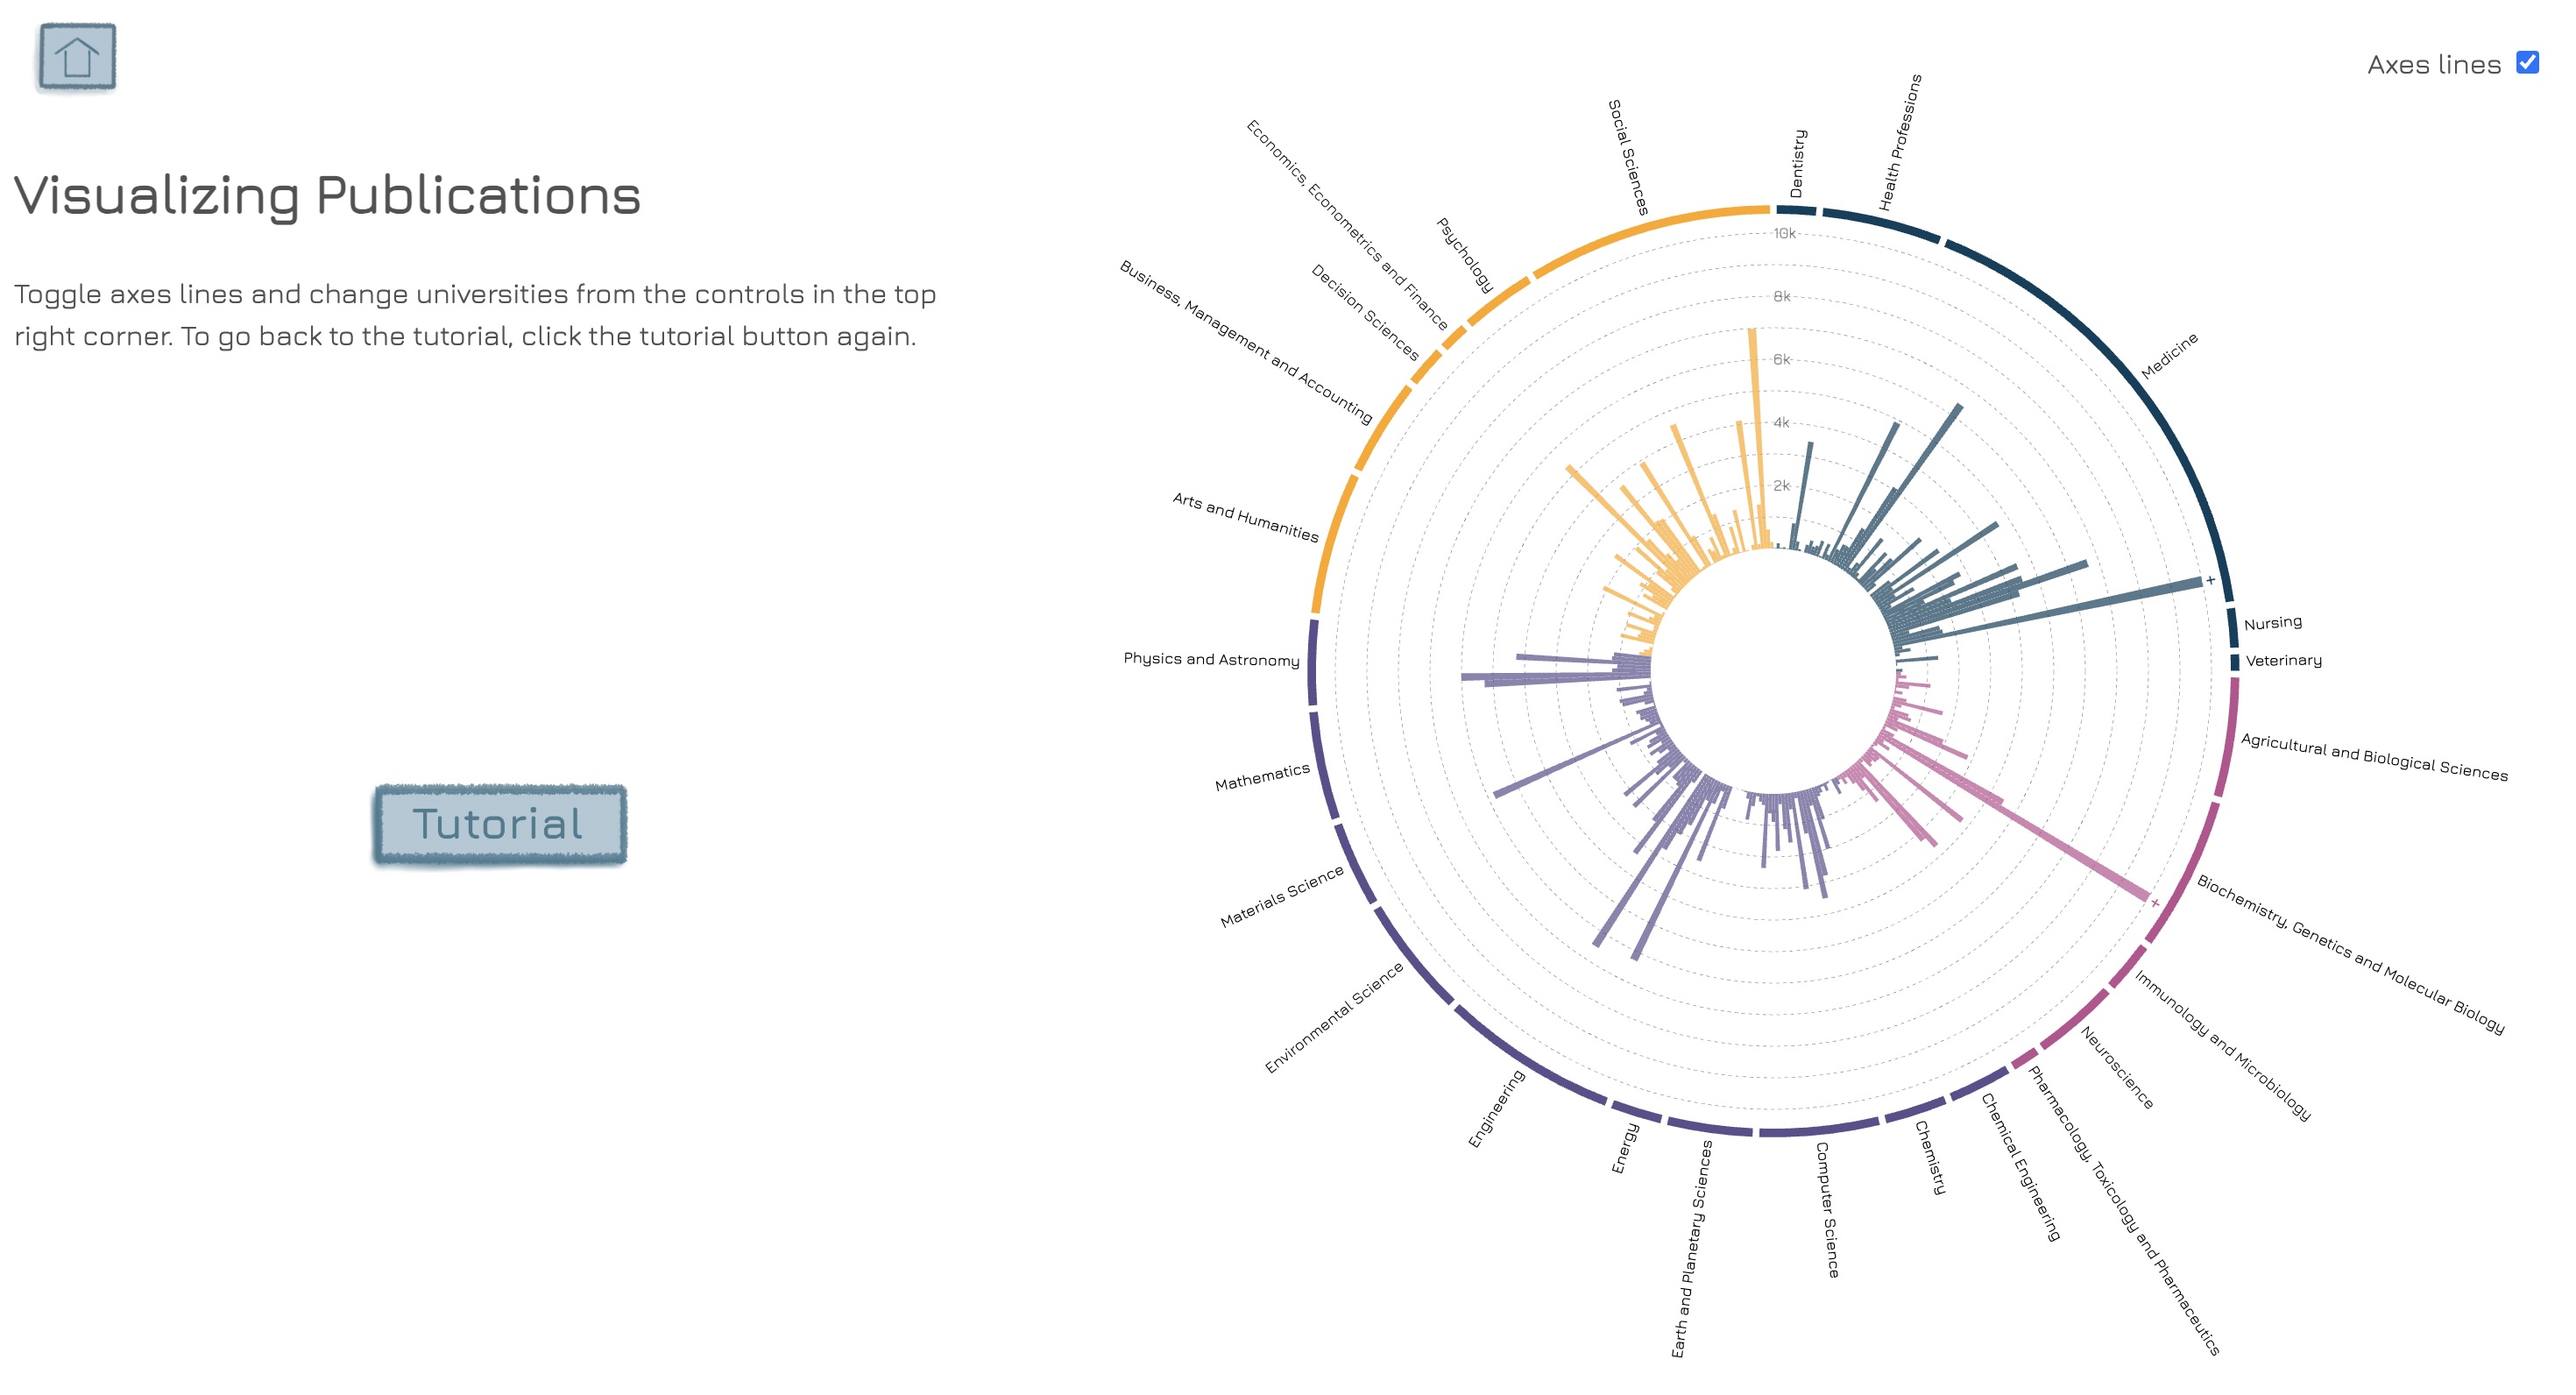
My first reserach project with the Connected Data Hub. I was tasked with creating a hierchical data visualization given a dataset of UVA research publications by domain, group, and field. After researching different tools, I landed on D3.js for its customizability despite its steep learning curve. I then created my initial sunburst plot, which has since expanded to host a dashboard. After adding interactability to my suburst, I created the coauthorship network using Helios, an open source graph visualization tool.
The website is live and can be viewed here.
Tools/ Skills: D3.js, Javascript, CSS, HTML