Data is Art Entry
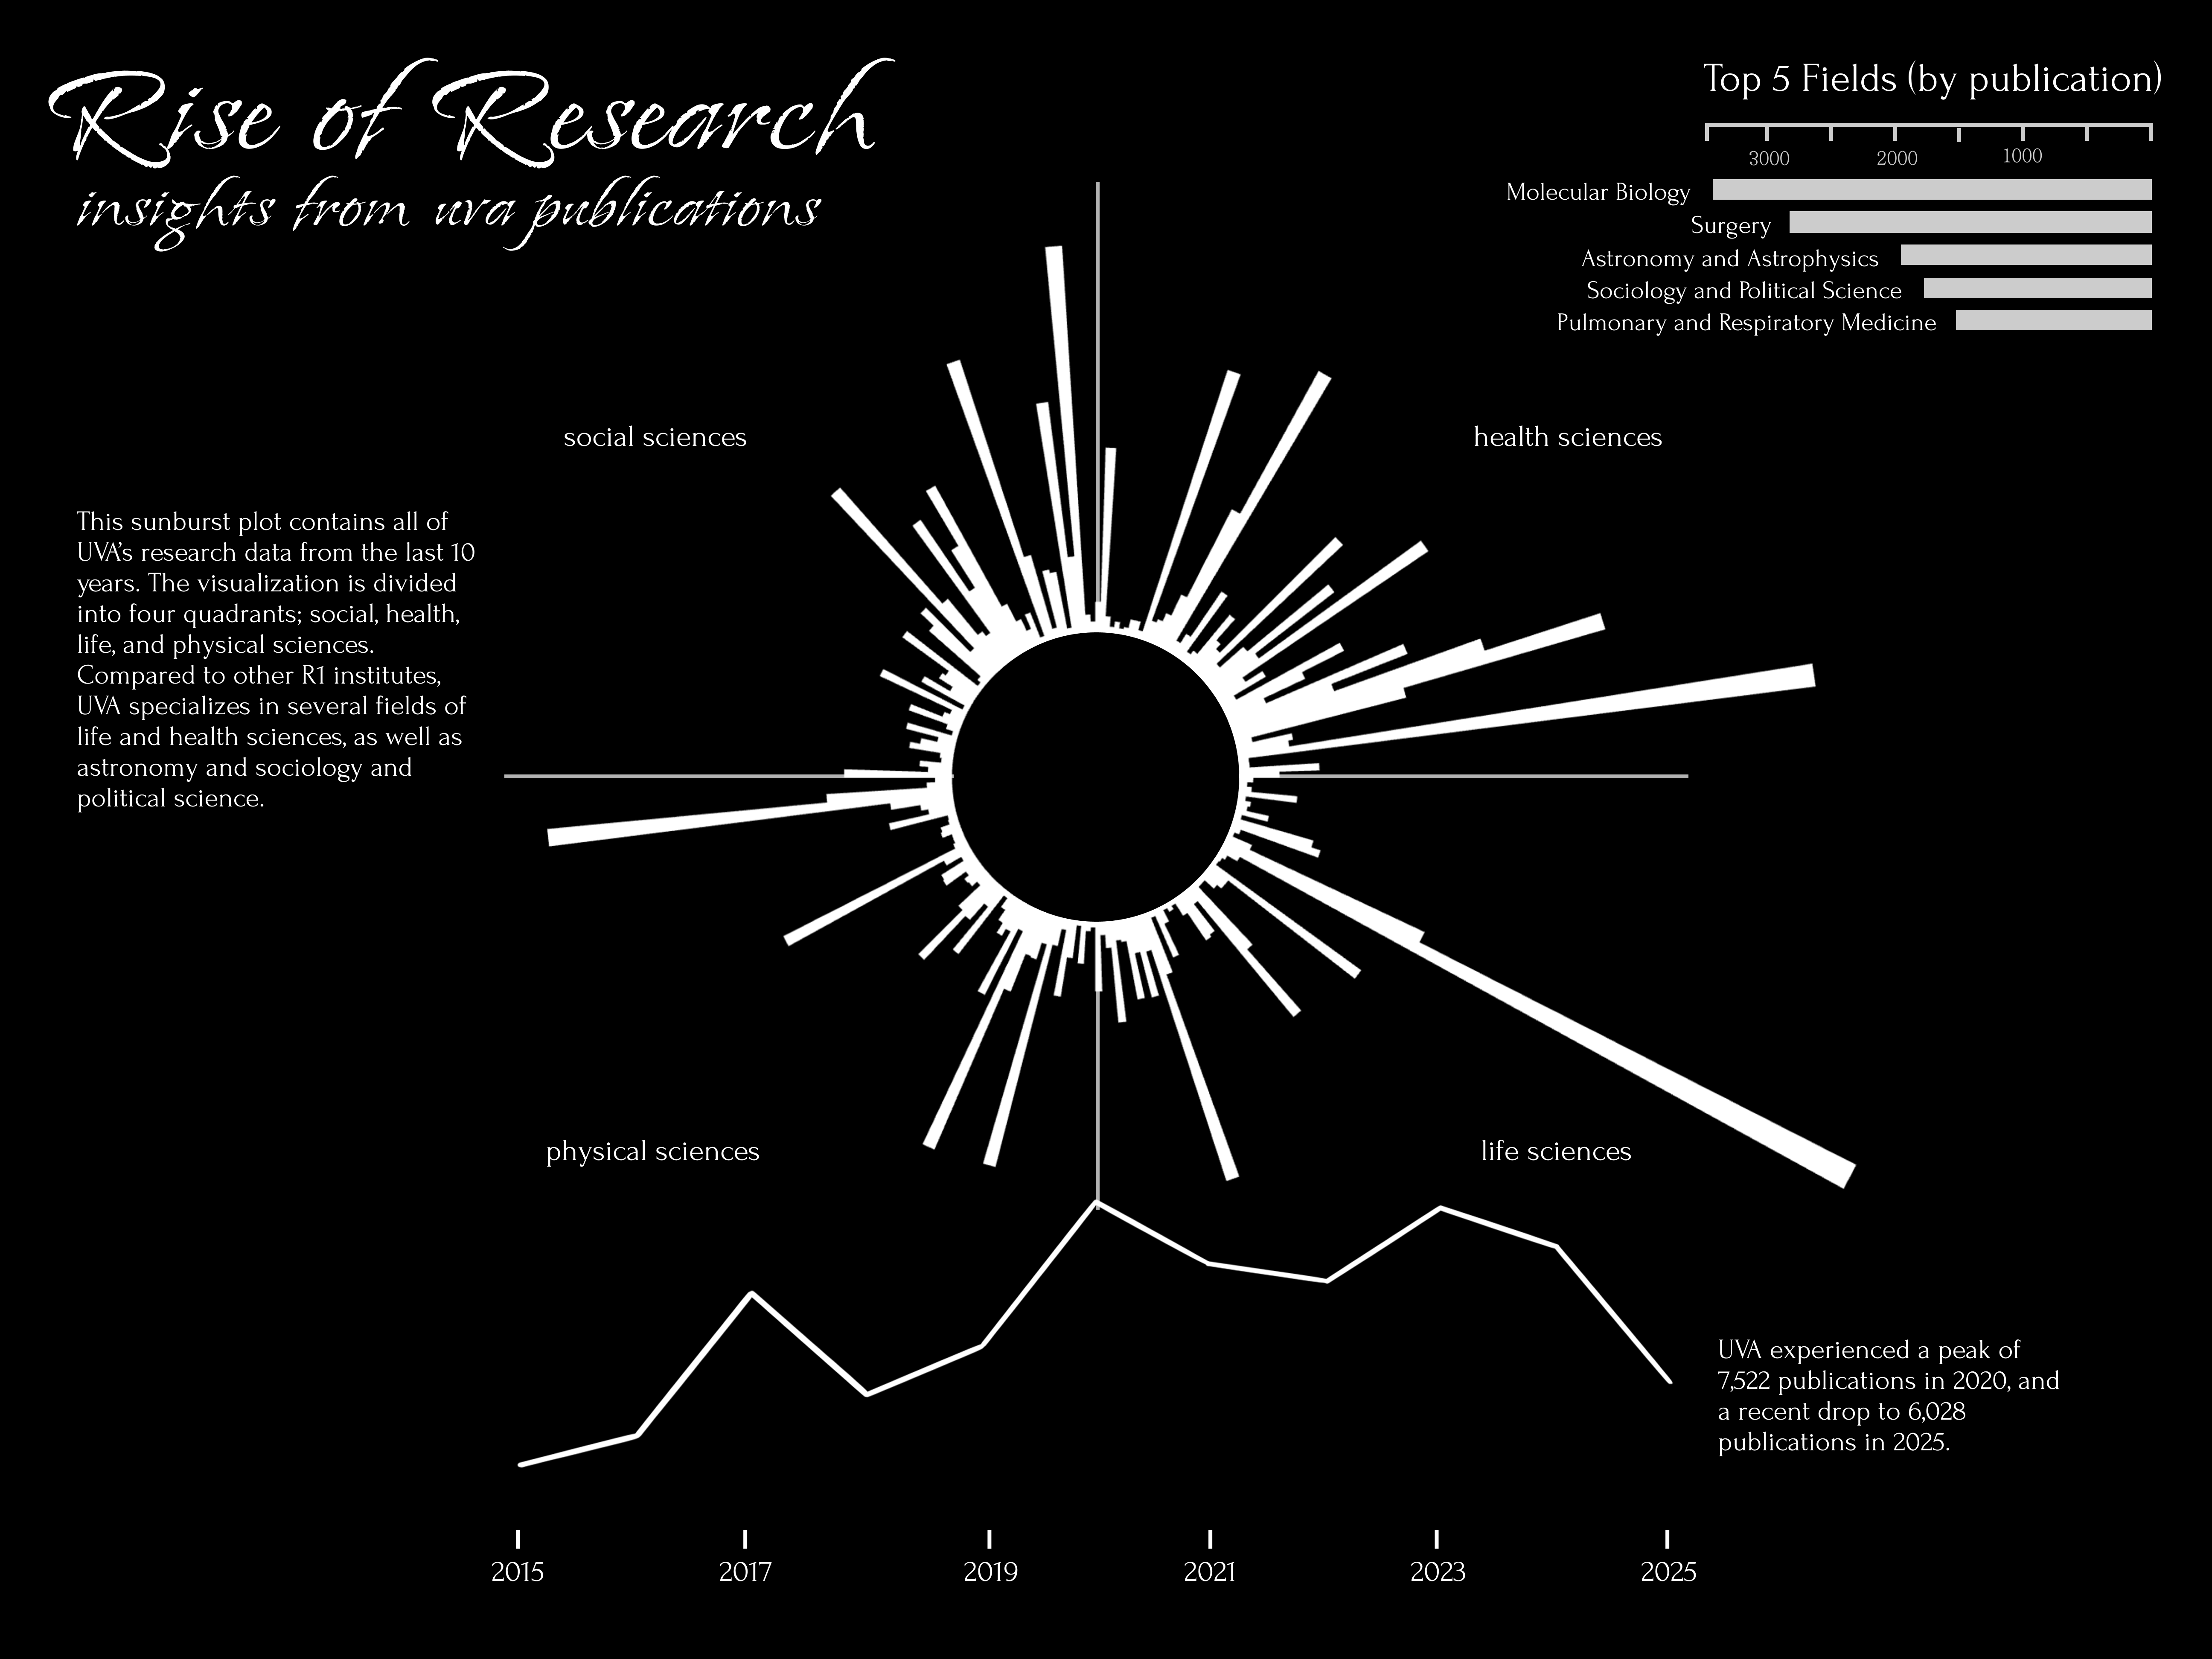
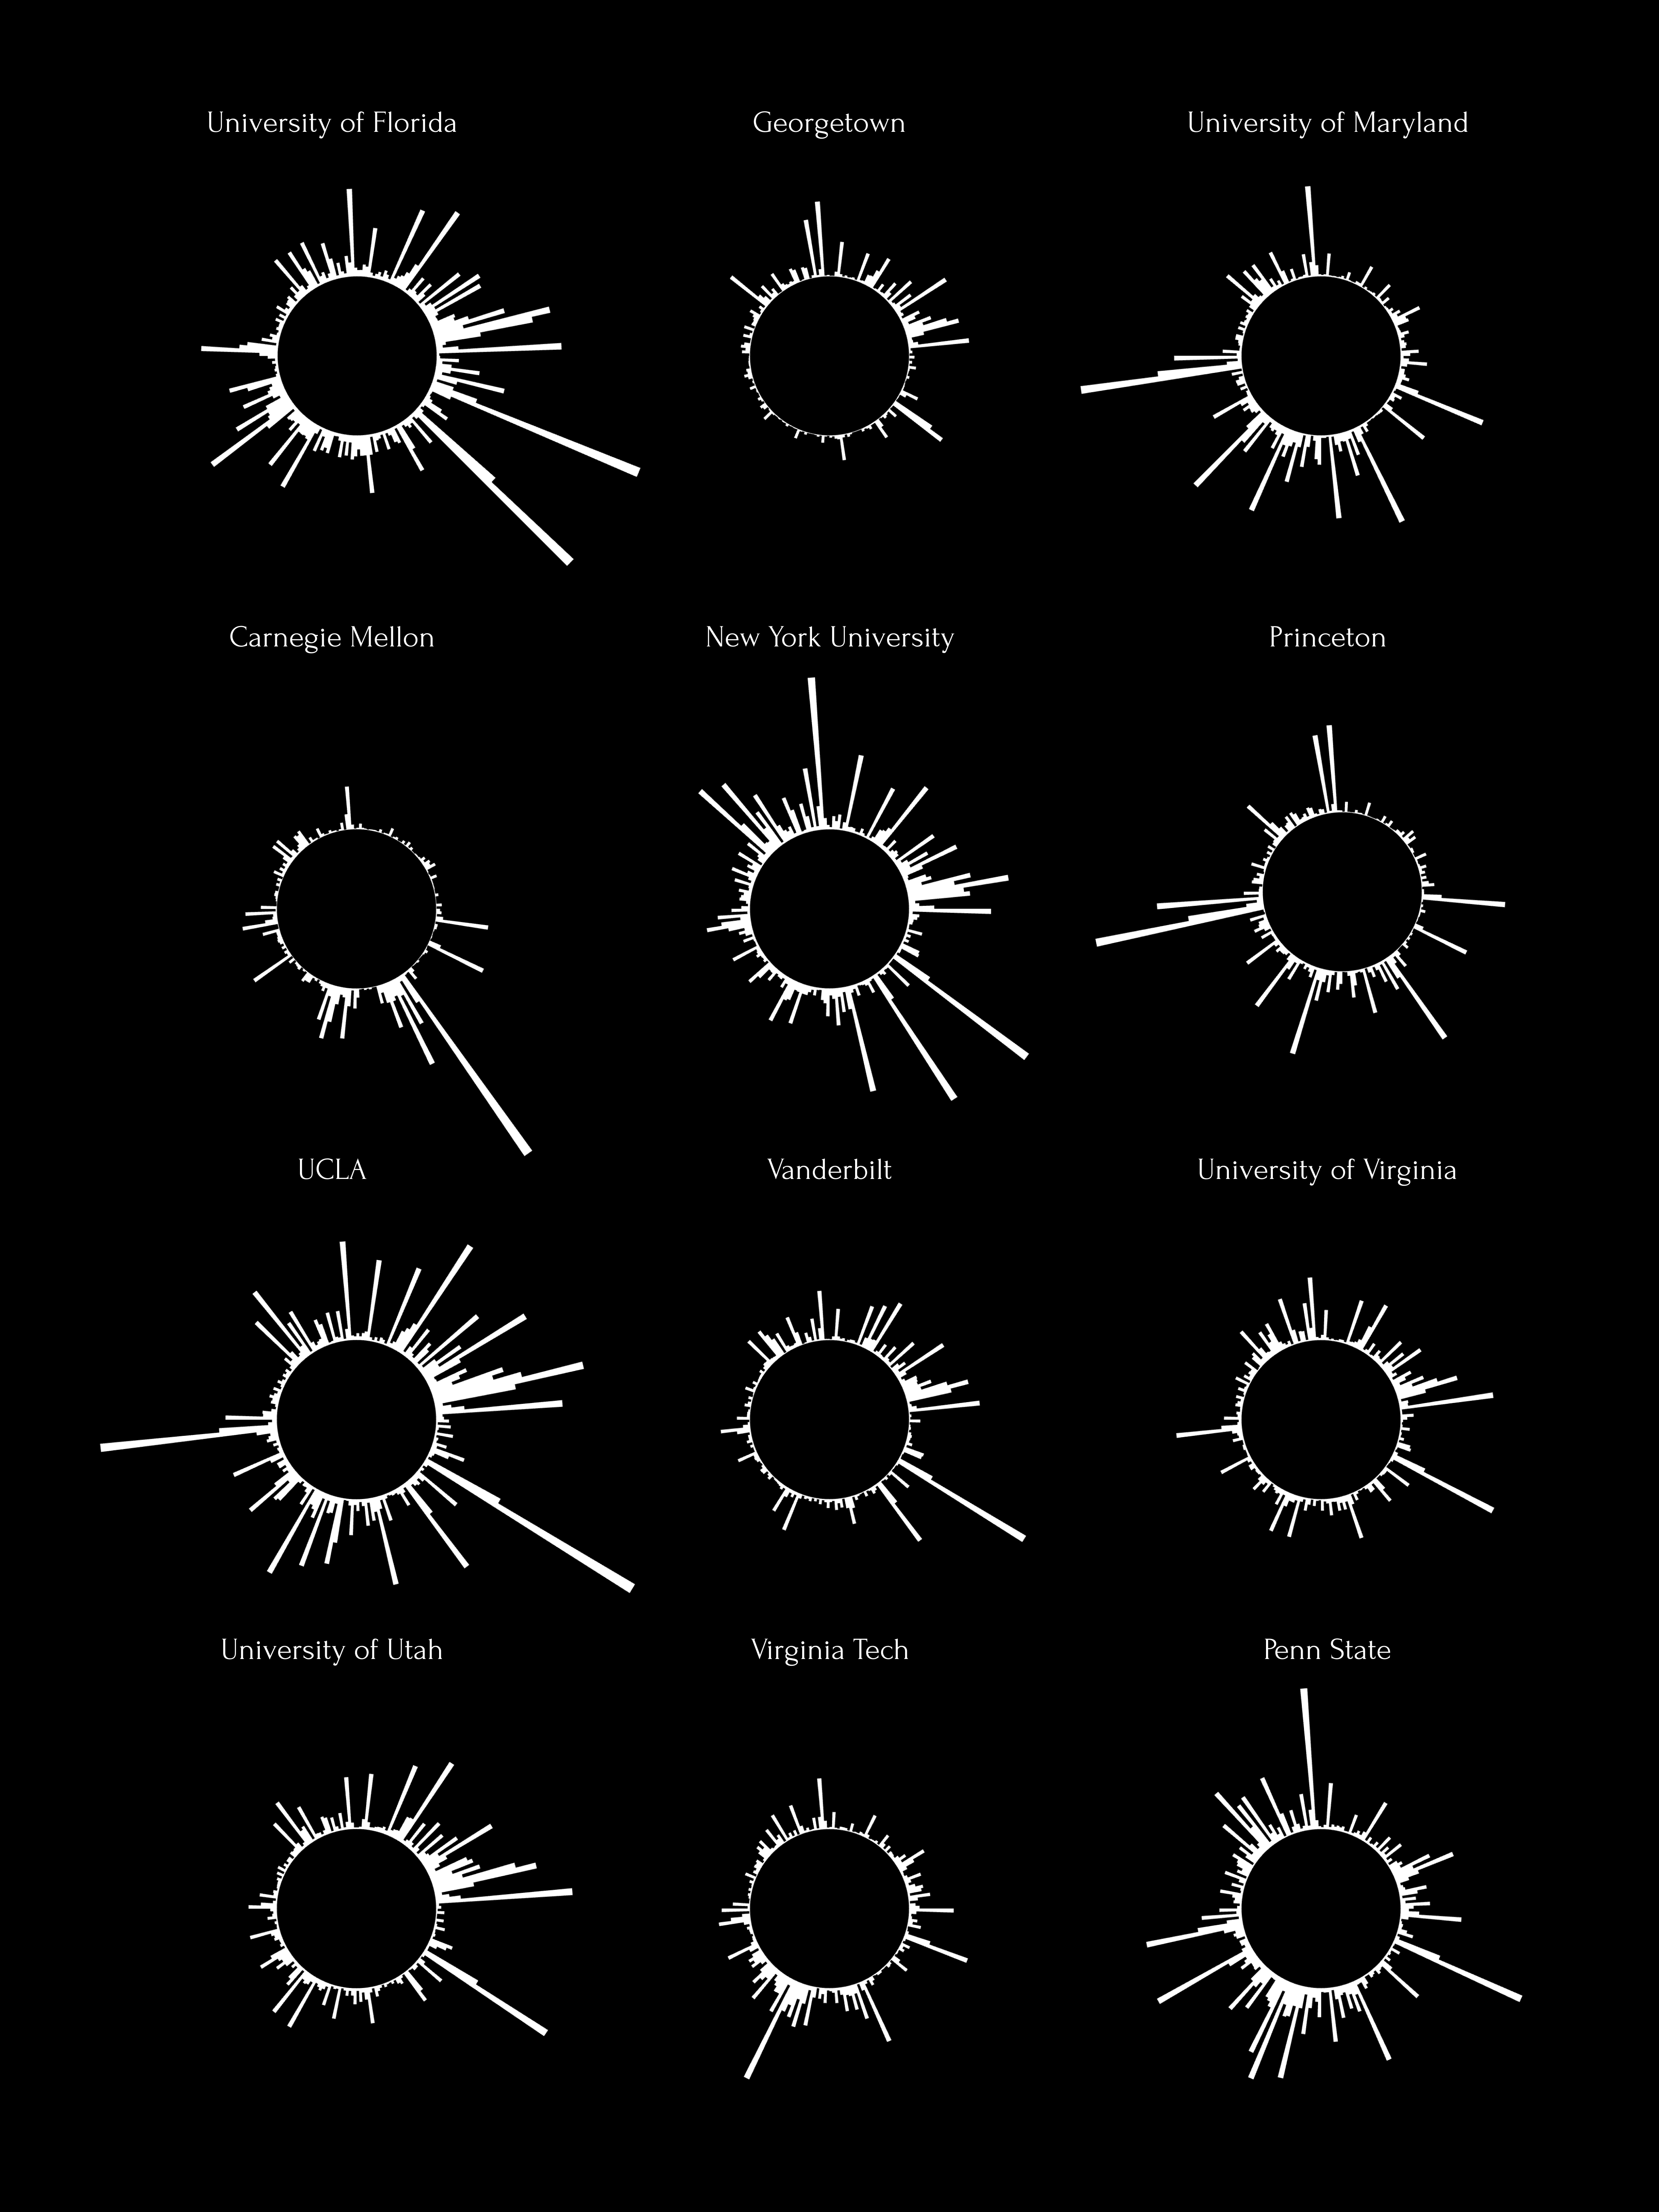

Rise of Research: Poster Visualization of UVA Research
April 2026
My submission to UVA's data art competition. This project visualized UVA and R1 institutions' research output over time using poster designs and animation (watch here).
By querying OpenAlex for publication data, I was able to scrape data from 12 different R1 institutes over the span of 10 years, in addition to 15 years of UVA research data. Find the full query and code in my GitHub repository.
Tools/ Skills: Figma, Python, HTML, CSS