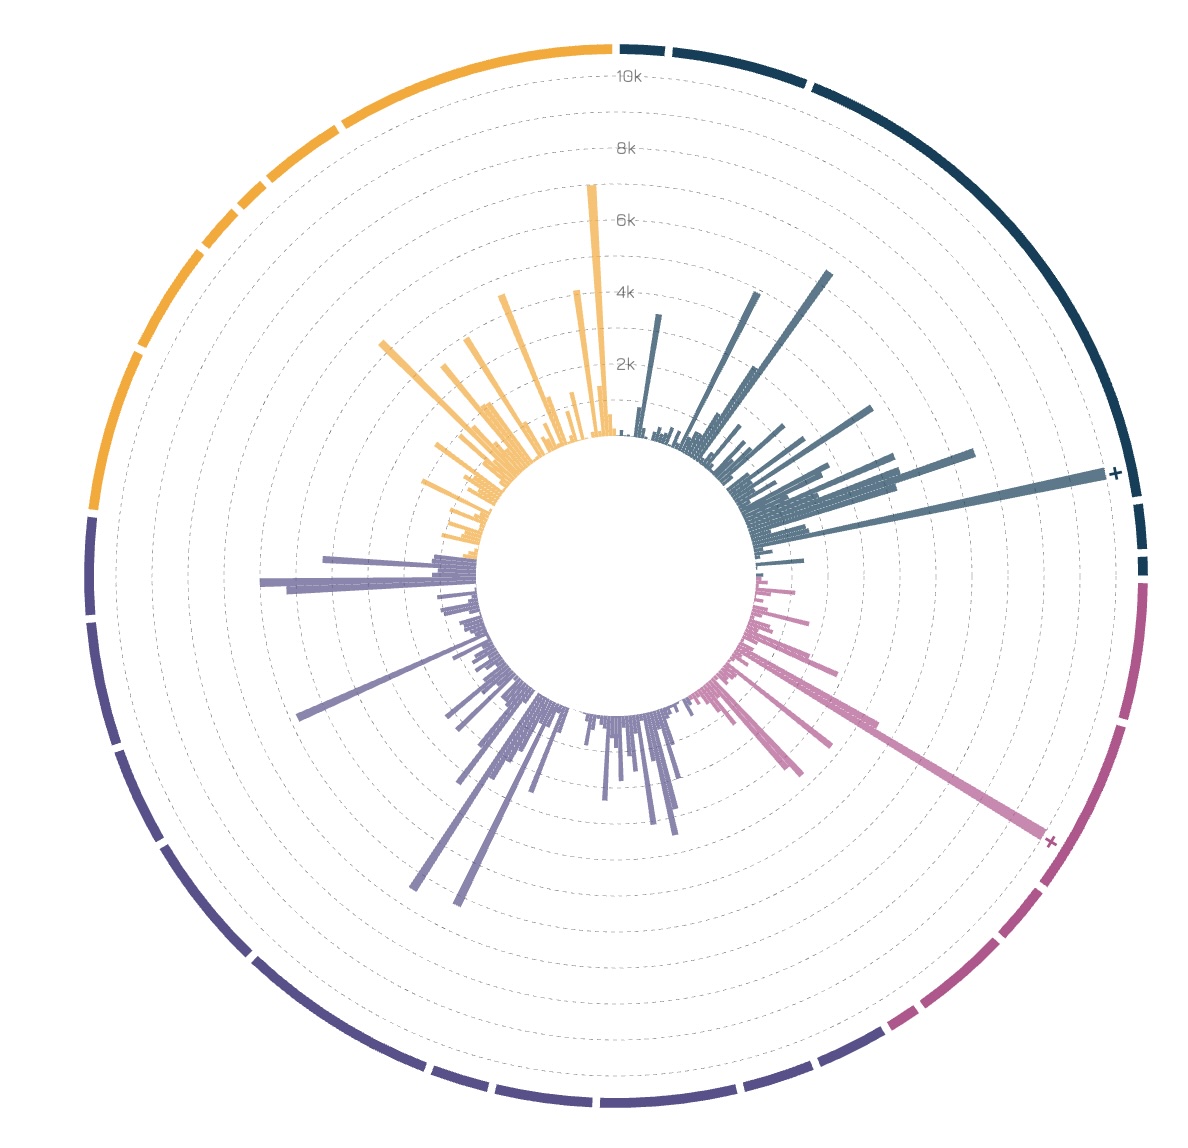
This visualization focuses on research at R1 Institutes like UVA and Virginia Tech by observing their number of published papers by domain. These domains are divided into four parts:
,
Health Sciences,
Life Sciences, and
Physical Sciences.